Apple is America’s favorite stock, there’s no doubt in my mind. There isn’t another stock or asset class out there that I get asked more about by friends or financial media. We love their products and it has the largest market capitalization of any stock. It therefore shouldn’t be a surprise that it gets so much attention. I was going through all of the Dow 30 components last night and $AAPL was one of the ones that stood out because it’s levels are so well-defined. We like clean charts and I think this is one of them.
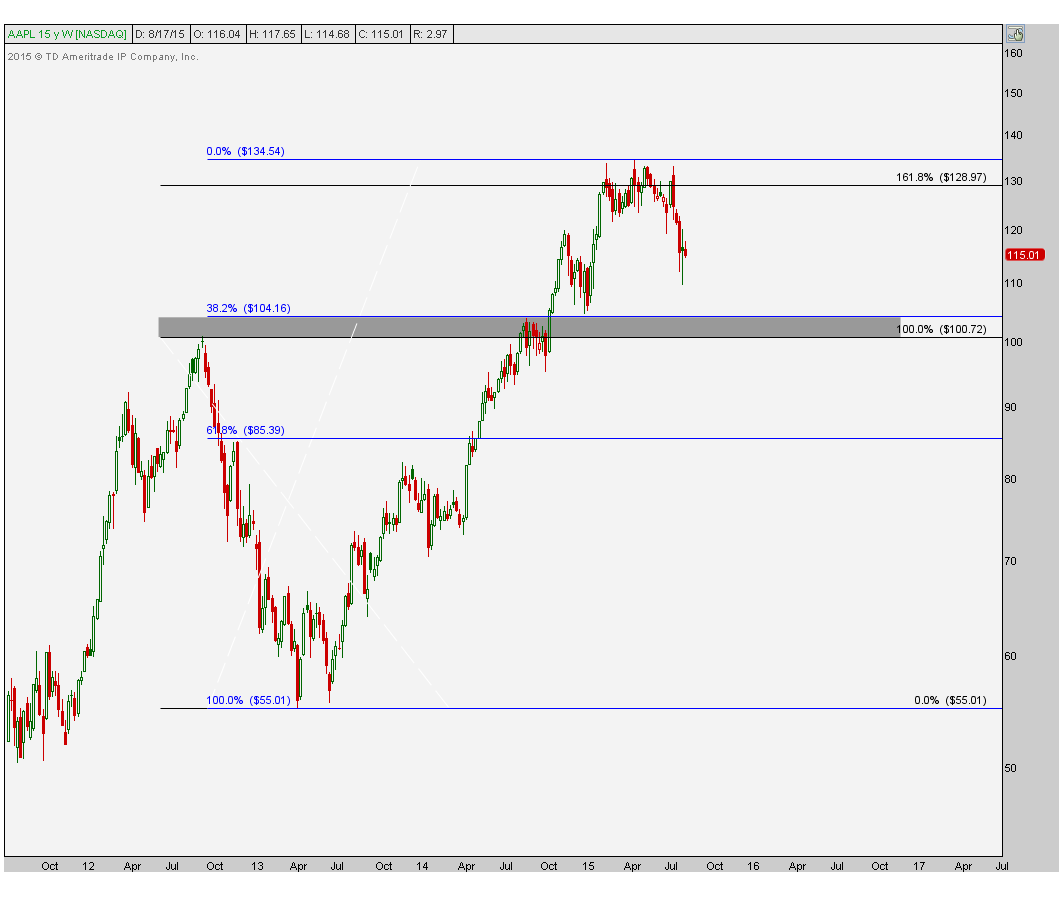
The first chart we have today shows the weekly timeframes hitting out upside target near 130 back in February. This came from the 161.8% Fibonacci extension of the entire 2012-2013 correction. Since then I’ve been very consistent in reiterating that it’s been dead money at best and the opportunity cost is simply too much to bother with. Fortunately the market responded nicely at those levels and prices have since then rolled over. We can see on this chart that the $100-104 area really stands out. This was former resistance at the peak in 2012 (split adjusted) and some trouble once again last year before its final leg higher. That former resistance should turn into some support and that’s where I think we’re heading:
Notice how I also included the Fibonacci retracements from the lows in 2013 to this year’s absolute highs, which had slightly exceeded our upside targets temporarily before quickly reversing hard to the downside. The 38.2% retracement of that entire 2013-2015 rally is right near $104. This reiterates to me how important this area is for Apple.
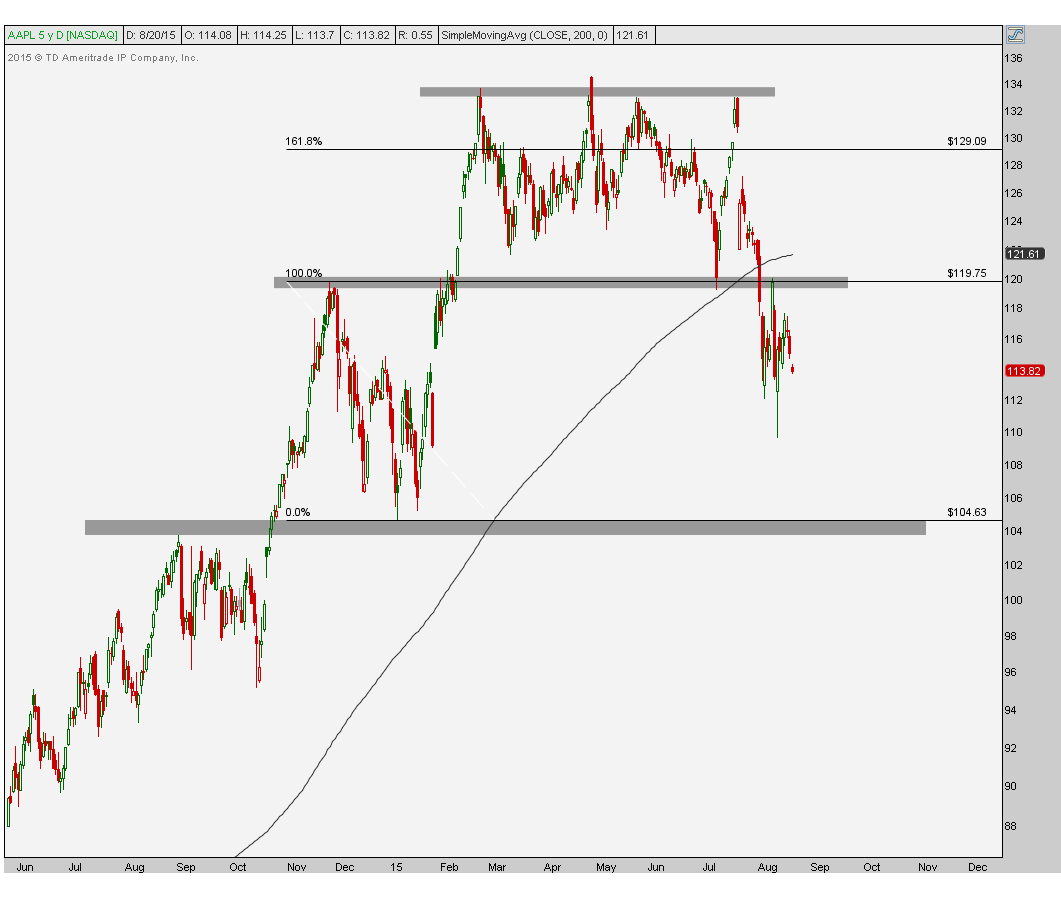
Looking a bit more near term here is the daily timeframe showing prices breaking back down below that former resistance in November and February near $120 after the consolidation since hitting our upside objectives in February resolved to the downside. When sideways ranges like this, that tend to be continuation in nature, resolve negatively, that’s typically a bad sign. For right now the levels seem to be fairly clean. I would be fading any strength towards $120-121 where we run into that former resistance and support last month as well as the 200 day simple moving average that appears to now be flattening:
As far as downside targets go, that support near 104 stands out once again as this was resistance last September and support in January. I would be covering short positions down there. This is not something I would want to buy here as both weekly and daily timeframes suggest a neutral trend at best and most likely more downside.
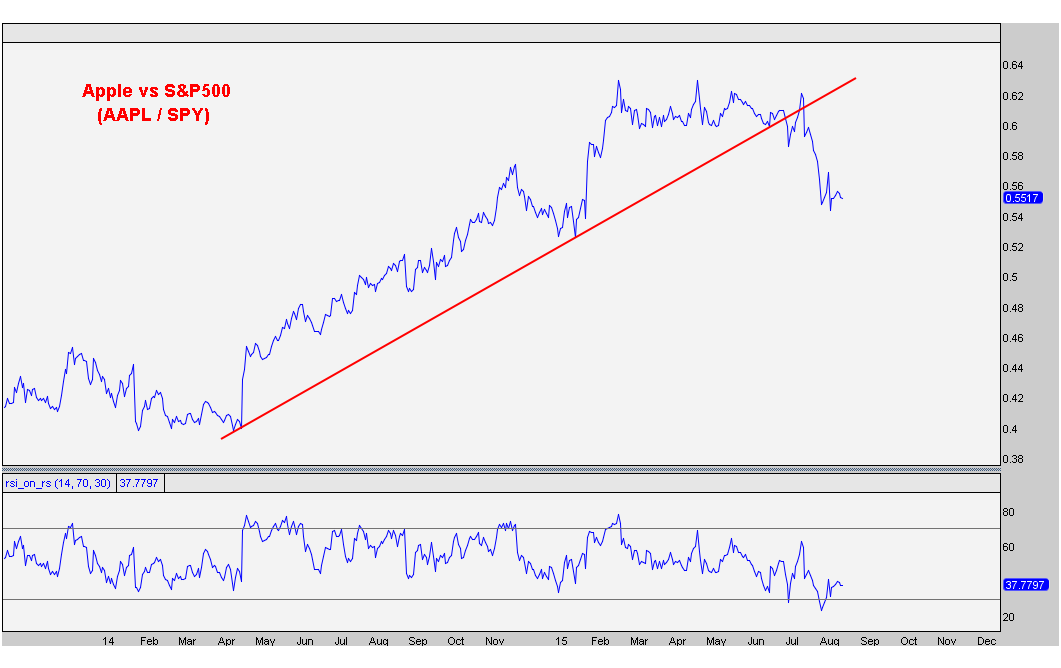
If you want to look at Apple on a relative basis, this is now an underperformer. Funny how quickly things can change. Here we’re looking at $AAPL relative to the S&P500 breaking the uptrend line from the lows last year. I also included momentum readings so you can see how we are now in a bearish range hitting oversold conditions (14-period RSI). The new lows in momentum last month confirmed the new lows relative to the market. So not only do we not want to own this on its own, but relative to the market itself, it also looks ugly.
What do you guys think?
***
Click Here to receive weekly updates on these Apple charts above including the rest of the 30 Dow components on multiple timeframes.
Recent free content from J.C. Parets
-
 Overhead Supply in the Dow Components
— 9/23/15
-
 When Do We Buy McDonalds?
— 7/23/15
-
 Is It Time To Buy Apple? Or Is It A Sell?
— 7/22/15
-
 Webinar Tuesday November 18th
— 11/17/14
-
 Cisco Gets Ready for a Breakout!
— 10/06/14
-
{[comment.author.username]} {[comment.author.username]} — Marketfy Staff — Maven — Member


