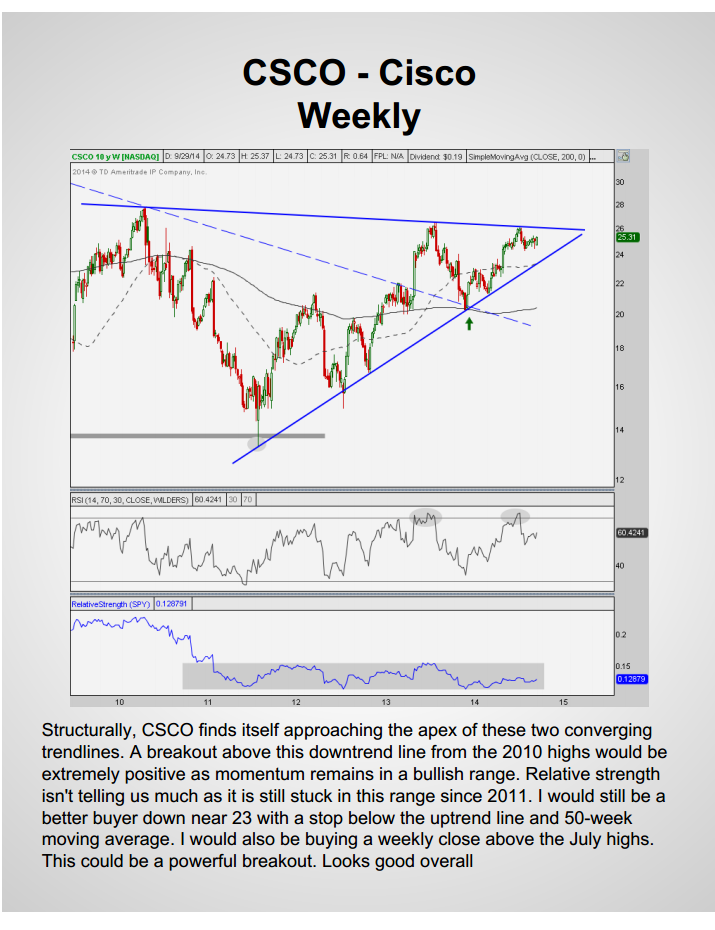
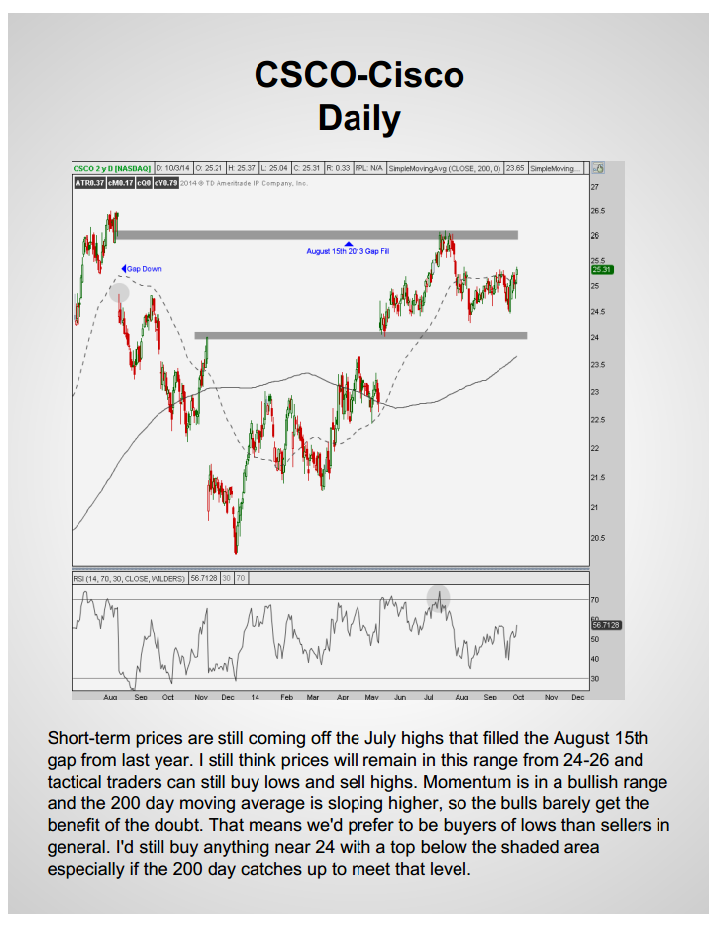
In this week's Dow 30 Report for members of Eagle Bay Solutions, I discussed the technical situation in shares of Cisco $CSCO. We are seeing it continue to consolidate towards the apex of this multi-year symmetrical triangle increasing the likelihood of an upside breakout. We are watching this one very closely. In our weekly reports we like to look at each of the Dow 30 components on multiple time frames to get both a structural and a tactical perspective.
This is a sample of what you’ll receive weekly for each of the Dow 30 Stocks:
Here are some tips to help understand the research and our process:
- These charts will be updated weekly with annotations and commentary detailing any and all changes in the data that may or may not change our perspective on a given market.
- The weekly charts and commentary are geared to get a much more structural perspective on the market and relative strength. The daily charts are for more tactical trading opportunities. Both time frames can be used together and don’t always agree with one another. For example, a bullish weekly chart can easily be accompanied by a bearish short-term setup and vice versa.
- You won’t always agree and that’s okay. The idea behind membership is to consistently have an unbiased opinion to supplement any prior thesis.
- There are other details on the charts that can be mentioned but for the purposes of these reports we will focus on only the most relevant and actionable information.
- Since the markets are fractal, we use the same period for our moving averages and momentum on both daily and weekly time frames
- Smoothing Mechanisms = 50 & 200 period Simple Moving Averages Momentum = 14 Period Relative Strength Index (RSI)
Recent free content from J.C. Parets
-
 Overhead Supply in the Dow Components
— 9/23/15
-
 How Low Is Apple Going To Go?
— 8/20/15
-
 When Do We Buy McDonalds?
— 7/23/15
-
 Is It Time To Buy Apple? Or Is It A Sell?
— 7/22/15
-
 Webinar Tuesday November 18th
— 11/17/14
No comments. Break the ice and be the first!
Error loading comments
Click here to retry
No comments found matching this filter
-
{[comment.author.username]} {[comment.author.username]} — Marketfy Staff — Maven — Member
Want to add a comment? Take me to the new comment box!


