Modern times demand modern thinking in portfolio design. Learn more...
With the markets having basically marked time yesterday, it provides us an opportunity to ignore the near-term gyrations and continue our look at what the big picture indicators may be telling us.
We concluded yesterday's review by surmising that the price and momentum indicators are in pretty good shape at the present time. However, we also talked about the idea that these indicators have been "fooled" on a regular basis for the better part of the last two year. As such, I concluded that we should take a longer/deeper look at both our external factor models/indicators and our primary cycle models.
Let's start with what I call the external factor indicators. But first a caveat...
When looking at this group of models, we need to recognize that these are definitely NOT timing indicators. In fact, they are pretty awful in terms of calling the near-term action. Again, the objective of these models is to give us a feel for which team has the odds on their side from a big picture standpoint.

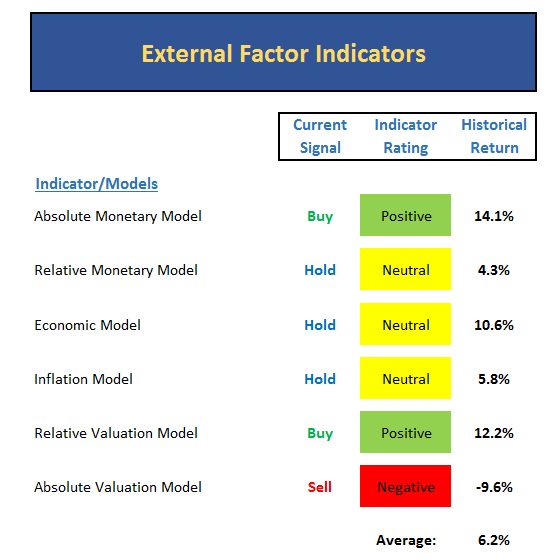
So let's see, in this group there are two green boxes, three yellow boxes and a red box (which effectively turns the valuation component to neutral). The quick and dirty takeaway then is this... Can you say neutral?
Digging in a little, we see that the monetary situation remains moderately positive due to the fact that rates remain at historic lows and are unlikely to move significantly higher any time soon. However, if the Fed starts to talk about raising rates more than twice more in 2016, stocks could easily start to struggle.
The next area of concern is the economic model. While still neutral, the reading of the model has continued to drop recently. This does NOT ...


