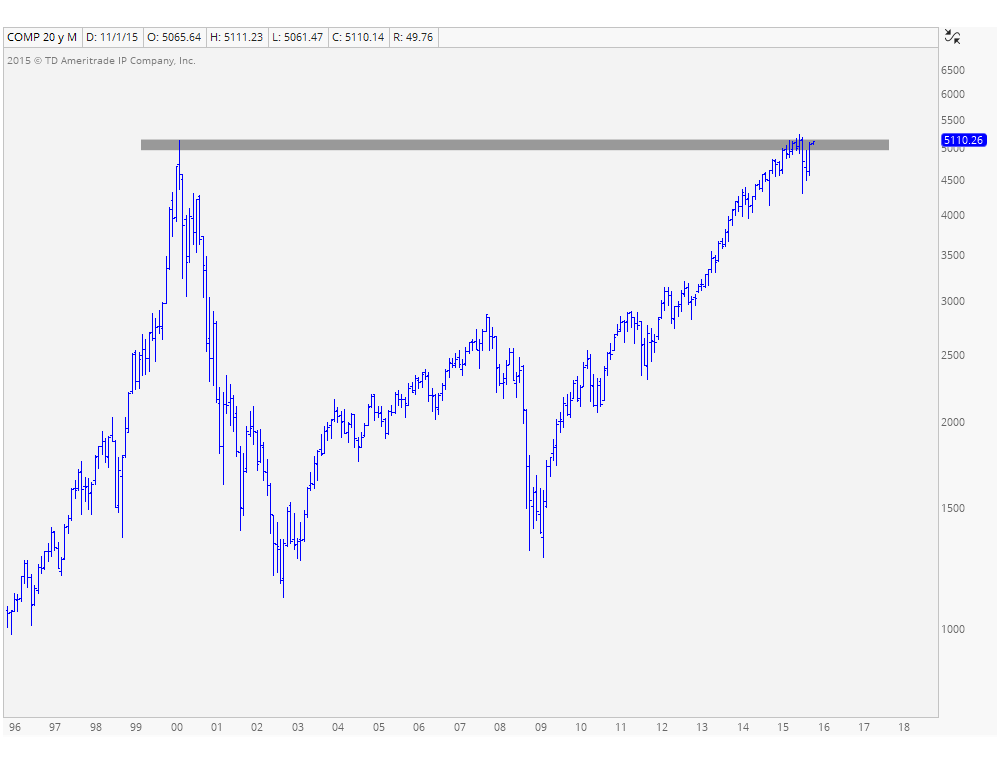
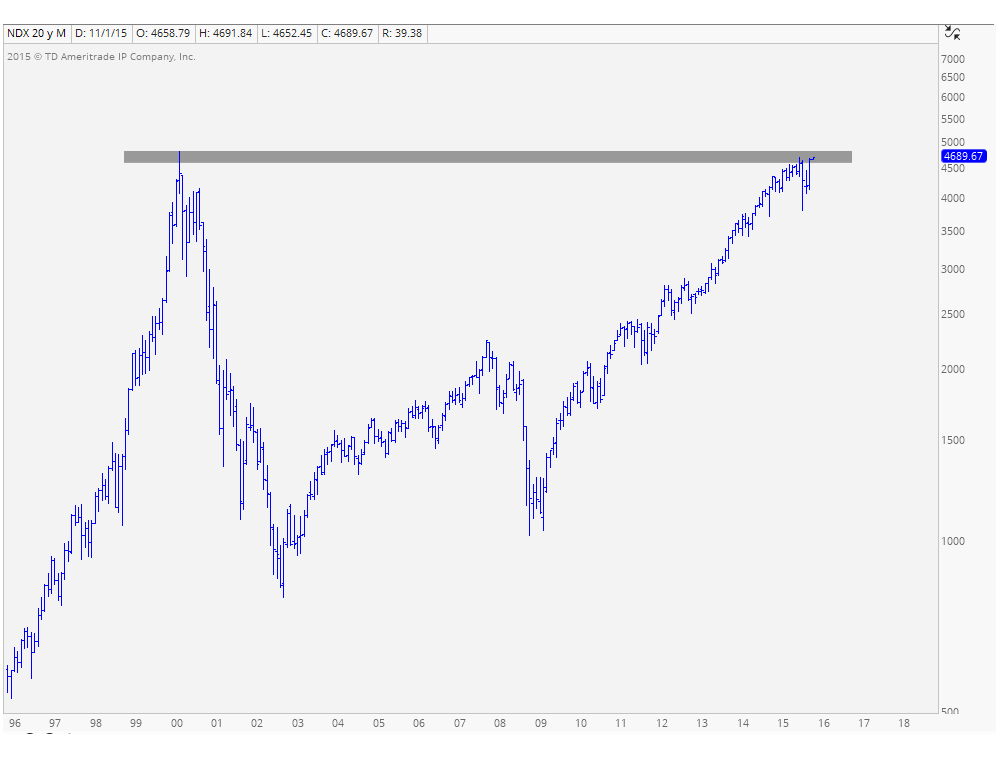
If you have any appreciation for supply and demand dynamics in the stock market you are likely to flip through a chart or two throughout your day. In my case, I flip through hundreds of charts a day, sometimes thousands. These include stocks, commodities, Currencies, Futures, ETFs, Indexes, and all on multiple timeframes – daily, weekly and monthly charts. One that keeps coming up on my radar is the Nasdaq, both the Composite and the 100. The reason is because we’re now back up towards March 2000 highs. This was the peak before the crash that took place over the next 2 years. It took over 15 years just to get back up here. But now what?
This is a chart of the Nasdaq Composite, which represents a much larger list of companies than the Nasdaq100, which is only 100 names. As you can see, we’re right near the March 2000 highs and have been struggling to get/stay above it. There is a lot of market memory here. Is this where we want to be putting new money to work?
Here is the Nasdaq100 which looks eerily similar. This one is more heavily weighted towards big tech companies like Apple, Microsoft, Google, etc. Again I ask: Is this where we want to be putting new money to work?
I don’t know whether the Market, in the case the Nasdaq, is going to rip right through this former resistance and continue to new heights. No one does. I am simply asking the question: Is it smart to be putting new money to work on the first test of resistance that goes back to the all-time highs in 2000, right before the stock market crashed and lost 80% of its value?
What do you guys think?
***
Click Here to receive weekly updates on these charts on multiple timeframes as well as the rest of the major U.S. Indexes like the S&P500, Dow Jones Industrial Average, Russell2000, Nasdaq100, etc.
Recent free content from J.C. Parets
-
 Miami This Week For The Finance Festival
— 11/04/15
-
 Video: Technical Analysis Webinar by JC Parets
— 9/29/15
-
 Overhead Supply in Healthcare & Biotech
— 9/22/15
-
 Thinking Out Loud Heading Into Q4
— 9/22/15
-
 Seller of Strength, Not a Buyer of Dips
— 9/16/15
-
{[comment.author.username]} {[comment.author.username]} — Marketfy Staff — Maven — Member


