

Seller of Strength, Not a Buyer of Dips
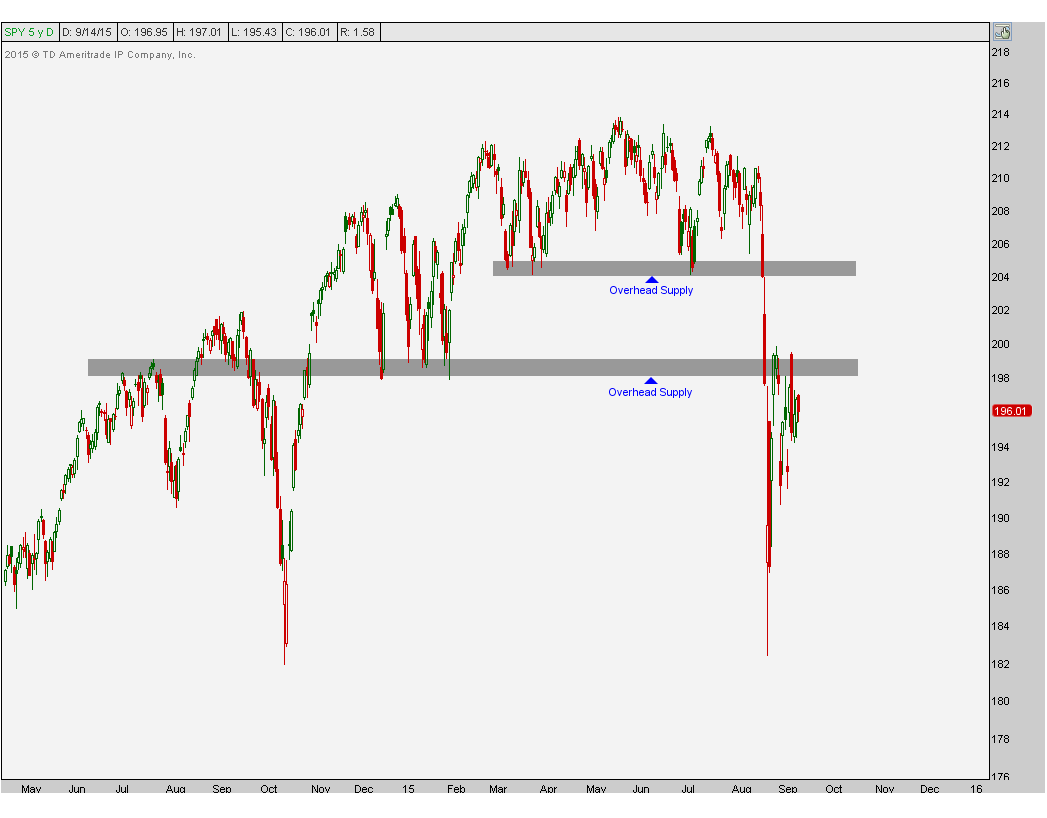
A big theme that I’ve been talking about over the past month is the overhead supply that we have across the U.S. Equities market. Not only are we seeing this in the major averages, but it is also visible throughout a lot of individual sectors and sub-sectors. The questions that I keep getting from investors and financial media revolve around at what point or price would I want to buy U.S. Stocks. The problem is that I don’t have the answer. You see, I’m not trying to buy stocks; I’m trying to sell stocks if we see higher prices. Rather than wanting to buy dips, I prefer to sell into rips. And if we don’t get any rips, then oh well, there are other asset classes and other areas to be both long and short that are uncorrelated to U.S. Stocks. It’s a big world out there. Here is the S&P500 below overhead supply:
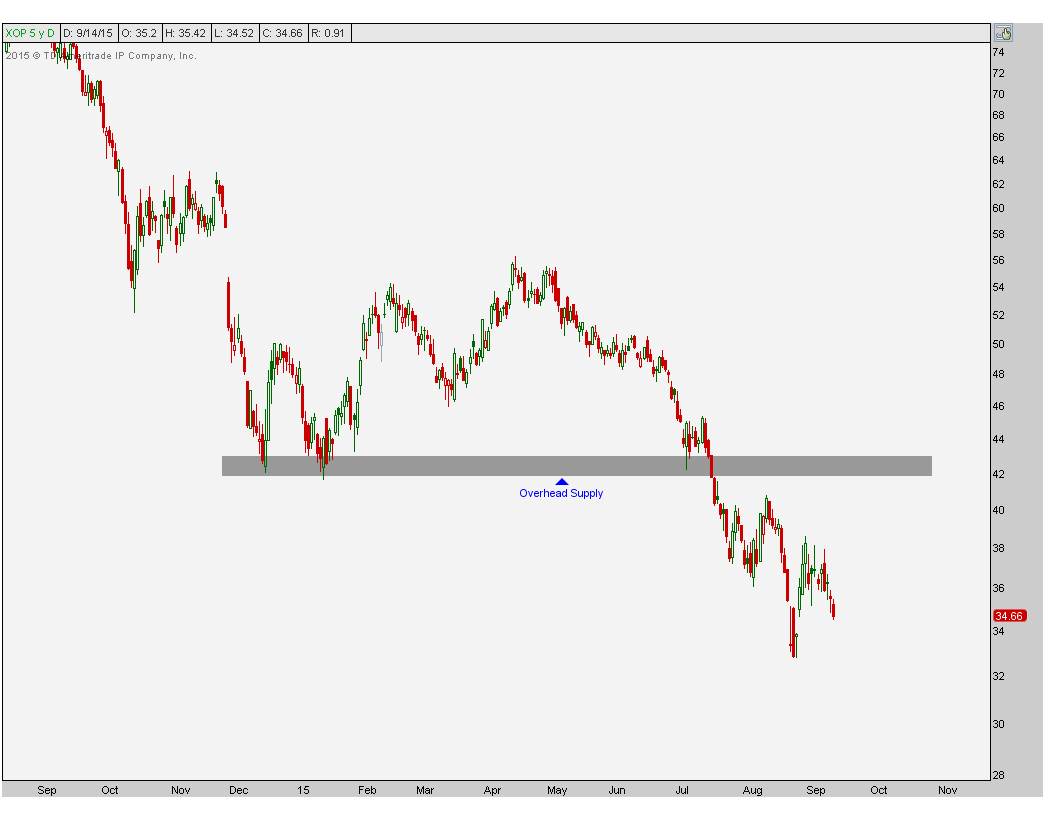
The Energy sector and its sub-sectors are good examples as they hit all of our downside targets late last month. But even if we get bounces from these lows, we will run into the brick wall that is “overhead supply”. When key former support breaks down panicking the longs into selling, those that did not sell are now left holding the bag. That’s the “please just get me back to even” crowd that is sitting there waiting to sell to you. The E&P names are a good example:
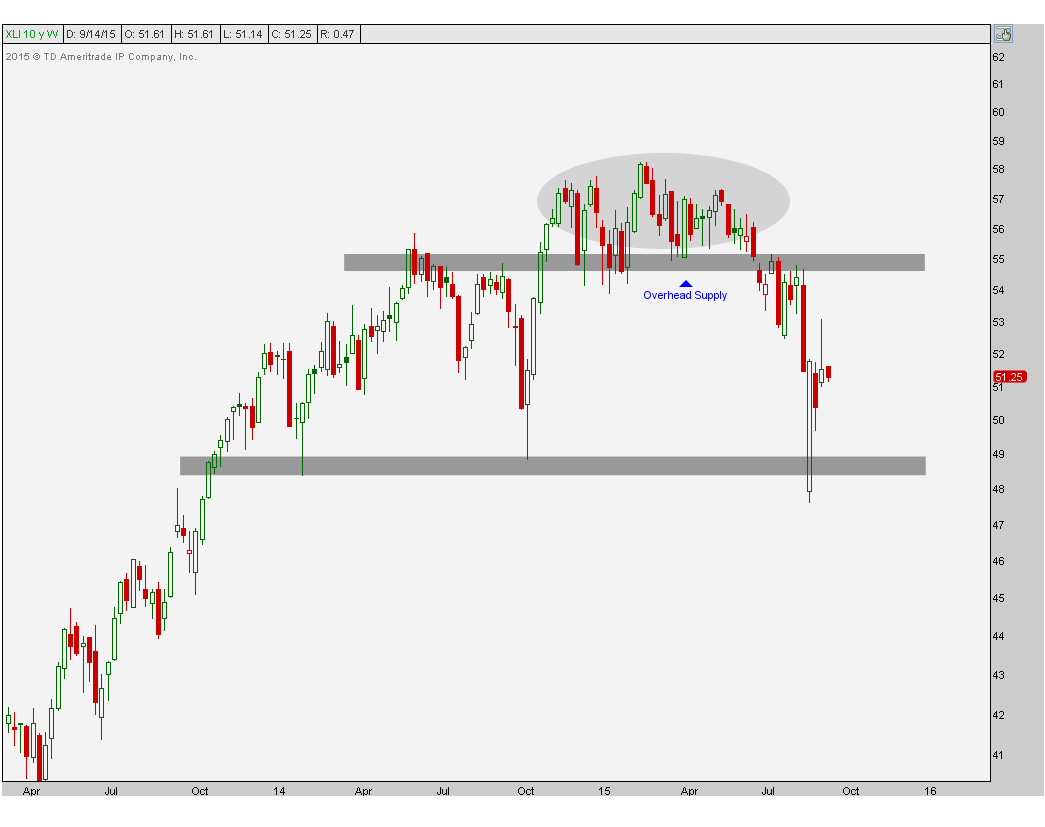
The Industrials are another good example. Although our downside targets in the S&P Industrials ETF $XLI were hit last month, I would rather sell strength than buy these dips. There is very clear support in $XLI that goes back to the lows in 2013 which held again in the summer of 2014 near $48. Looking short-term, however, we are below all of that broken support that goes back to earlier in the year. This is now overhead supply that we want to sell into if we get up there. The weekly timeframe shows this well:
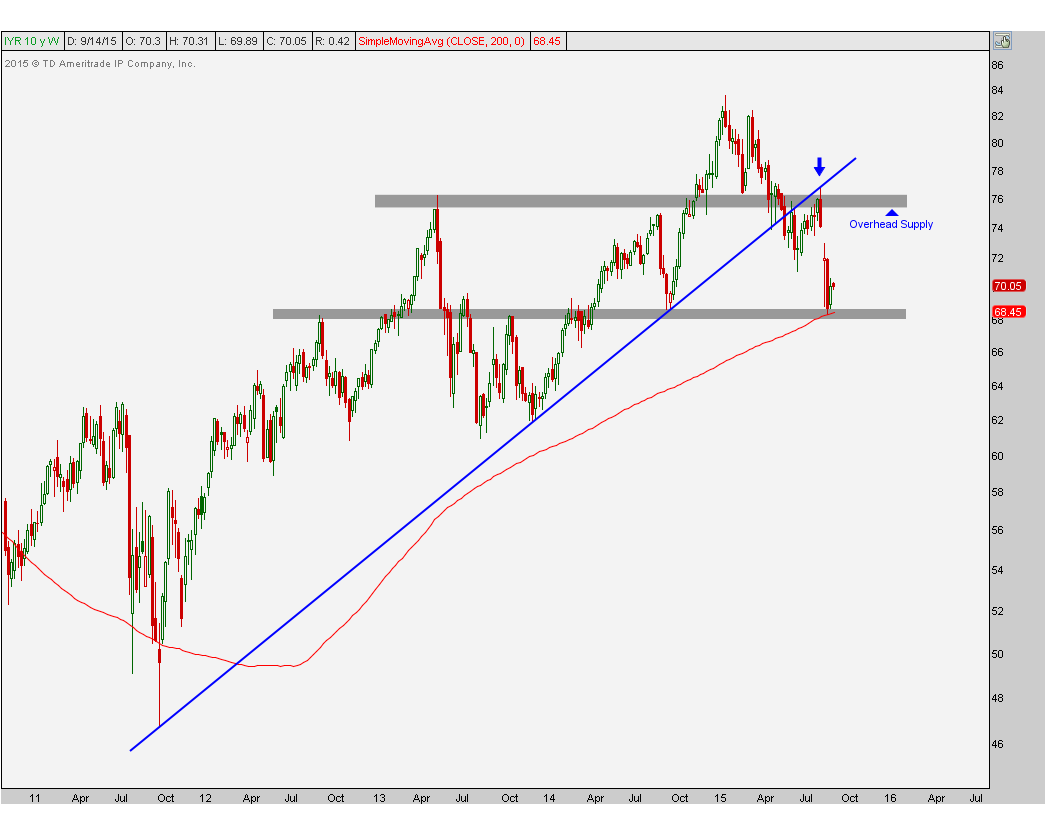
REITs are another good example. We are talking about a sector that broke its uptrend line from the 2011 lows. This was problem #1 and then on any attempt at an advance, prices successfully retested that former trendline support, and sure enough it then turned into resistance. At this point, our downside target has been hit based on the combination of a 200 week moving average and support from last October that had also served as resistance and support back in 2012-2013. The problem now is that all of this broken support in the mid-70s is still overhead supply. I’m not saying that we get back up there, but if we do, I would sell into that very aggressively. The weekly chart also tells the story well:
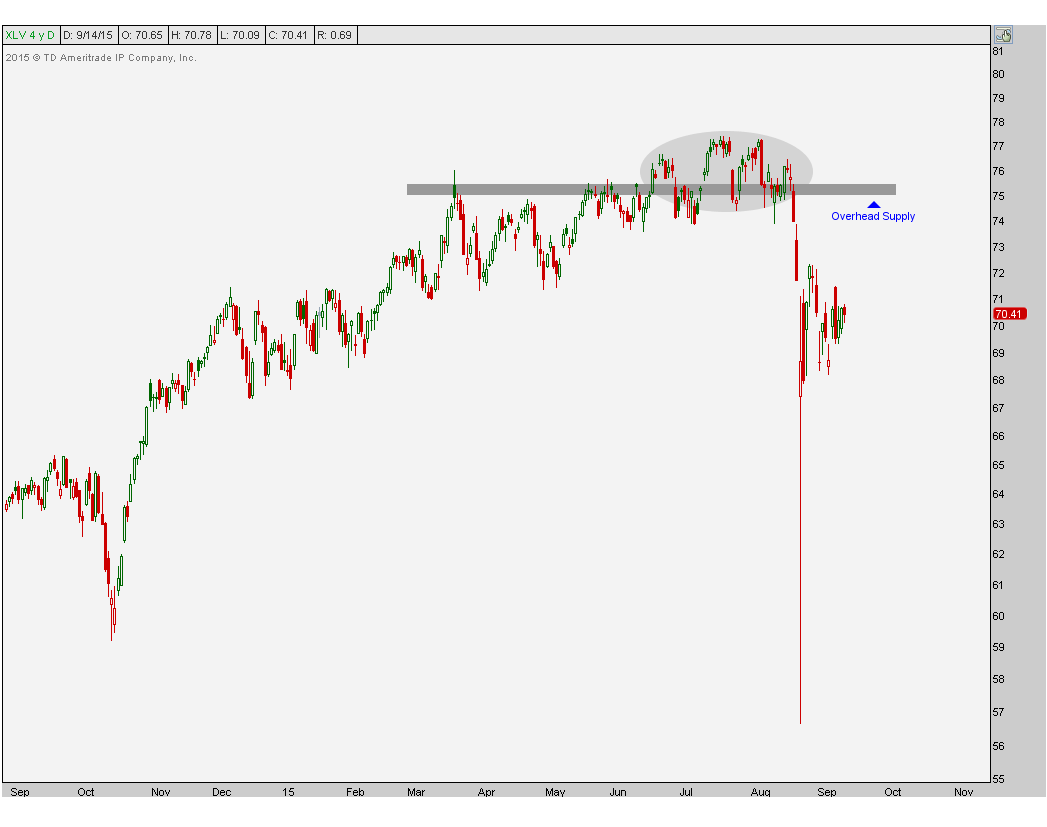
Healthcare is a sector where we’ve been expecting some aggressive selling over the past month (See: Is Healthcare Due For A Collapse?). Once we broke down below $75 we were thrilled to see prices crashing down. At this point, however, this is now fresh overhead supply from those that didn’t sell when they had to. We now want to be aggressive sellers into any strength back towards that area, if we get it:
There are plenty of more examples out there that I can point out, but I’d be here all day. Subscribers to our researchhave the entire list and receive weekly updates on the progress. You can register here to start receiving our reports.
I just think that looking for places to buy makes less sense than looking for places to sell. That’s how I see it. What do you guys think?
***
Click Here to receive weekly updates on each of these charts complete with 30 sectors and sub-sectors across the S&P500 including Energy, Financials, Gold Miners, Materials and Technology.
Recent free content from J.C. Parets
-
 Miami This Week For The Finance Festival
— 11/04/15
Miami This Week For The Finance Festival
— 11/04/15
-
The Nasdaq Flirts With All-Time Highs
— 11/02/15
-
 Video: Technical Analysis Webinar by JC Parets
— 9/29/15
Video: Technical Analysis Webinar by JC Parets
— 9/29/15
-
Overhead Supply in Healthcare & Biotech
— 9/22/15
-
Thinking Out Loud Heading Into Q4
— 9/22/15
-
{[comment.author.username]} {[comment.author.username]} — Marketfy Staff — Maven — Member

- 1 Campus Martius, Suite #200Detroit, MI 48226
- +1 877 440 9464