The stock market rallied nicely yesterday...and although talk of a fiscal deal out of Washington and news that President Trump was leaving the hospital got a lot of the credit for the advance...we believe the falling odds of a contested election played a the biggest role in the rally. It certainly makes sense...given how much the President fell in the polls following the first debate...and the fact that he seems to have put so many people at risk after finding out he had been exposed to somebody who had tested positive for Covid-19.
The rally came on very low volume of just 2.8bn shares, but the breadth was quite good. In fact, the advancers vs. decliners was 10 to 1 positive for the S&P 500...and 11 to 1 for the NDX Nasdaq 100 index. It was 4 to 1 positive for the Nasdaq Composite and 3 to 1 for the NYSE Composite index, so the rally was still relatively narrow, but not as narrow as it has been on other rally days in recent weeks.....We’d also note that the key leadership group we are watching so closely (the chip stocks) had another great day...as the SMH semiconductor ETF rose by 3.4%.
The further rise in long-term interest rates that we highlighted again yesterday morning did indeed help the bank stocks rally strongly yesterday...as the KBE rallied 3.6% and the KRE moved up 4.2%. The banks still have further to rally if they’re going to break above the key resistance levels that we’ve been focusing on recently, but yesterday’s action certainly took them even closer to those levels.
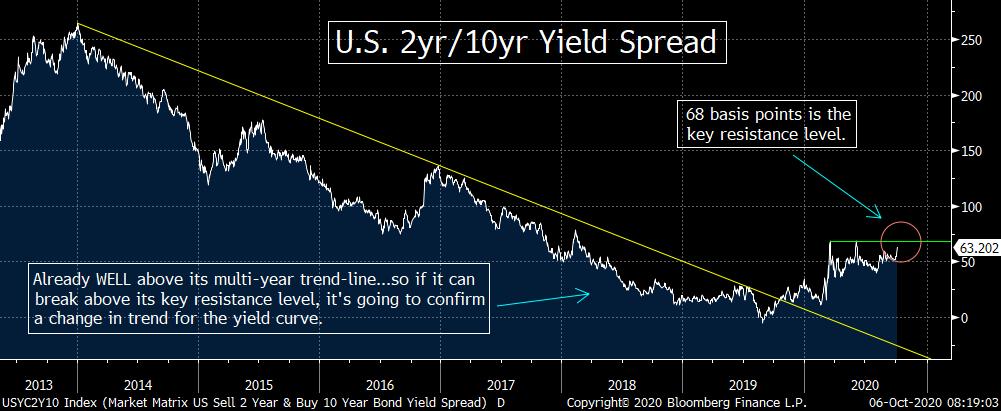
Another reason to think that the bank stocks could finally see a period of outperformance before the end of the year is the shape of the yield curve. They 2y/10yr spread has widened out in a meaningful fashion over the past few trading days...and is now approaching its “double-top” highs from March and June of 68 basis points. Of course, a move above 68 basis point would not make the yield curve incredibly steep, but it would still be a compelling development. The 2y/10yr spread has already move WELL ABOVE its trend line going all the way back to 2015, so if it breaks above that 68 basis point level in any significant fashion, it’s going to go a long way towards confirming a change in trend for the shape of the yield curve.
As always, we do not want to get ahead of ourselves. The spread between the yield on the 2-year note and 10-year note HAS to break above that 68 level in a meaningful way before we get too excited. However, the confirmation of a change in trend in the yield curve should be very positive for the bank stocks, so it’s something that investors need to keep a very, very, very close eye on over the coming weeks.
One of the best ways for institutional investors to help their performance over the last few months of a year...is to “ride” a lagging group higher. Of course, there are many years when NO “lagging groups” start to outperform in Q4, but when it does happen, it usually attracts a lot of attention from those institutional investors who are trying to play catch-up in terms of performance. (It also attracts buying interest from those who are ahead of the market...because they want to maintain their lead!)
Again, it is still too early to send up a big green flag on the bank stocks, but the upside potential is the best it has been for several years for the group. Many, many, many pundits have been telling us how cheap the group is on a fundamental basis...for three years...and it has continued to underperform. However, we looked beyond the fundamentals and remained cautious on the group. Now...some of these other issues are starting to change...so we will change our stance on the banks if (repeat, IF) those issues confirm a change in trend for long-term yields...and the shape of the yield curve.
Matthew J. Maley
Managing Director
Chief Market Strategist
Miller Tabak + Co., LLC
Founder, The Maley Report
TheMaleyReport.com
275 Grove St. Suite 2-400
Newton, MA 02466
617-663-5381
Although the information contained in this report (not including disclosures contained herein) has been obtained from sources we believe to be reliable, the accuracy and completeness of such information and the opinions expressed herein cannot be guaranteed. This report is for informational purposes only and under no circumstances is it to be construed as an offer to sell, or a solicitation to buy, any security. Any recommendation contained in this report may not be appropriate for all investors. Trading options is not suitable for all investors and may involve risk of loss. Additional information is available upon request or by contacting us at Miller Tabak + Co., LLC, 200 Park Ave. Suite 1700, New York, NY 10166.
Recent free content from Matt Maley
-
 THE WEEKLY TOP 10
— 10/23/22
-
 Morning Comment: Can the Treasury market actually give the stock market some relief soon?
— 10/21/22
-
 What Do 2022 and 1987 Have in Common?
— 10/19/22
-
 Morning Comment: Which is it? Is stimulus bullish or bearish for the stock market?
— 10/17/22
-
 Morning Comment: Peak Inflation is Becoming a Process Instead of a Turning Point
— 10/13/22
-
{[comment.author.username]} {[comment.author.username]} — Marketfy Staff — Maven — Member


