

The Question of the Day
The question of the day from a technical perspective is if the stock market is "breaking out" to the upside. If the answer is yes, then we need to assume that the next leg of the current bull market is about to get underway and all dips should be bought. Good times!
However, if we are in for yet another "breakout fake out" then traders need to play the game very differently. No, instead of a "buy high and sell higher" approach, it is usually better to "ride the range" when stocks are stuck in a sideways consolidation phase. In short, this means that traders may be looking to "sell the rips" while waiting for prices to test the lower end of the range.
But before we attempt to come up with an answer, let's take a look at the state of our trend and momentum indicators.
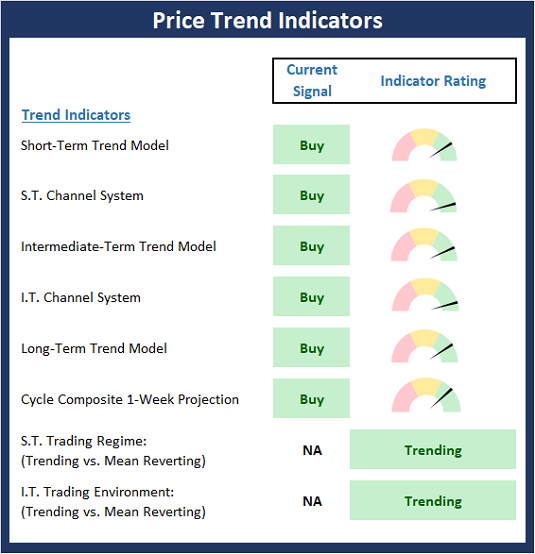
The State of the Trend Indicators
The Trend board indicators are designed to determine the overall technical health of the current stock market trend in terms of the short- and intermediate-term time frames.
The Trend board has scored a perfect 10.0 this week as every single box is green. There are two ways to look at such a reading. First, the bulls will opine that the current state of the trend board means the market is "in gear" and there is more upside to come. On the other hand, given the question of the day, the skeptic in me will note that universally favorable readings on the trend board often lead to pullbacks.
Gun to the head, I'll side with the bull camp here. Sure, stocks have all kinds of issues to deal with and a pullback could occur at any time, for any reason. However, as a long time "trend and momentum guy," I'm thinking the trend is my friend here.
NOT INDIVIDUAL INVESTMENT ADVICE.
View Trend Indicator Board Online
My Take on the State of the Charts...
As I wrote last time, one of the most positive things a market can do is to break out of a range. And to be sure, the S&P 500 appears to be breaking higher. But... In order for a breakout to be valid it must (a) be confirmed by other indices and (b) avoid dipping back into the range.
So, as the chart below suggest, the S&P appears to be "working" on creating a breakout.
S&P 500 - Daily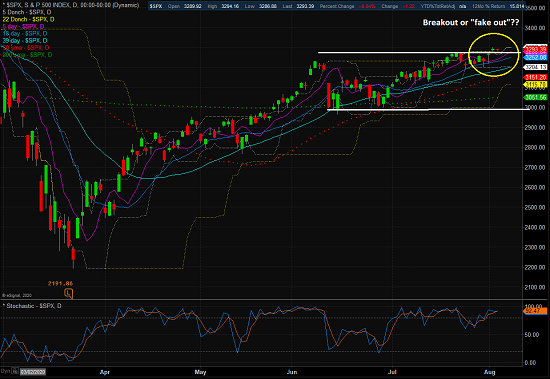
View Larger Chart
However, the fly in the ointment here is the "confirmation" part. As in, there isn't much to be found.
Looking through the charts of the major indices, I see that even the market darlings NASDAQ 100 remains stuck in a range and as such, hasn't confirmed the S&P's move.
NASDAQ 100 - Daily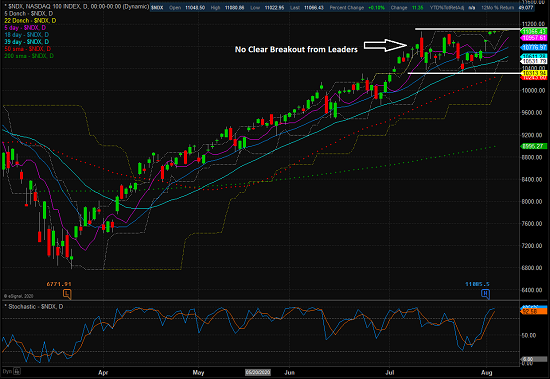
View Larger Chart
Looking at the rest of the indices, the same story holds. The DJIA is clearly going nowhere fast. The smallcaps are moving sideways. Same for the midcaps.
Therefore, I won't argue with anyone who remains skeptical of the bull case here.
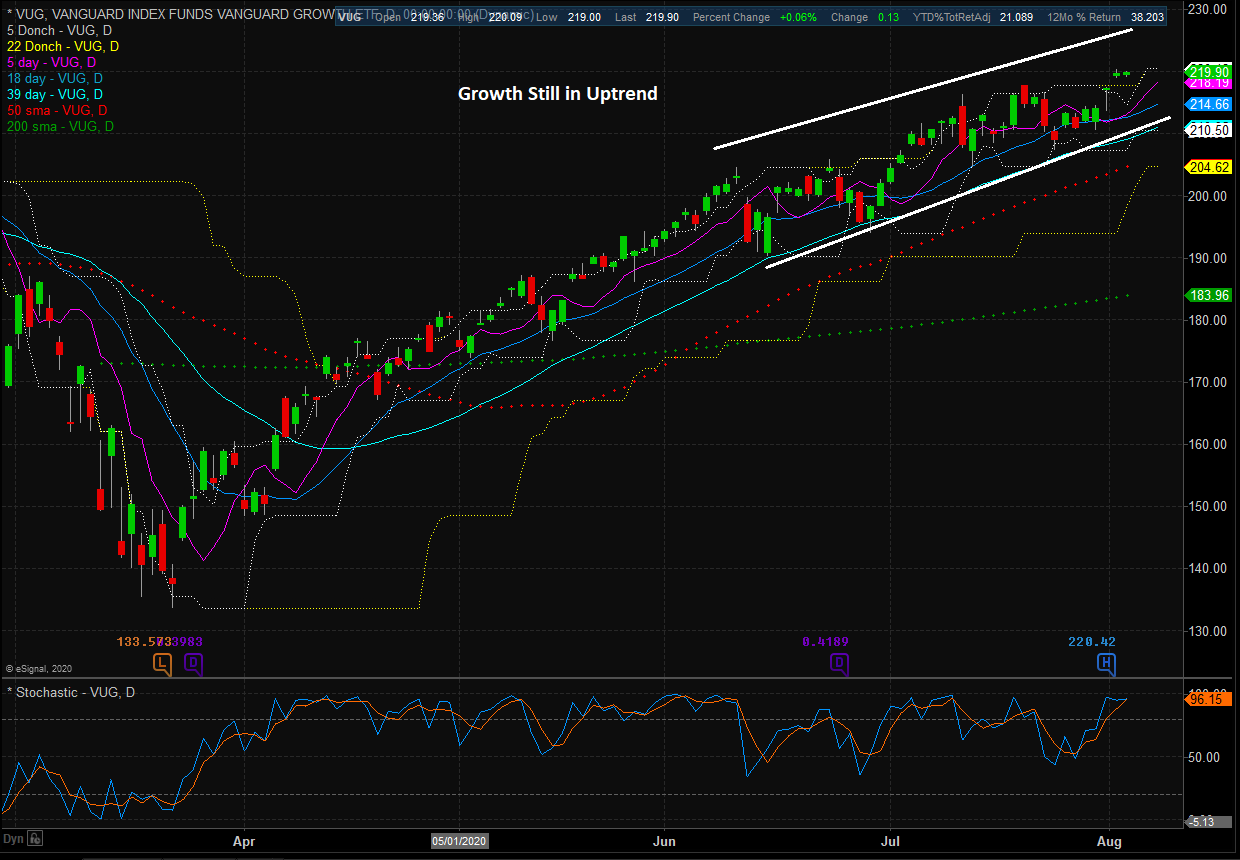
But there is some good news. Take a peek at the chart of the growth stocks (as illustrated by Vanguard's Growth Index fund - VUG) below.
Vanguard Growth (VUG) - Daily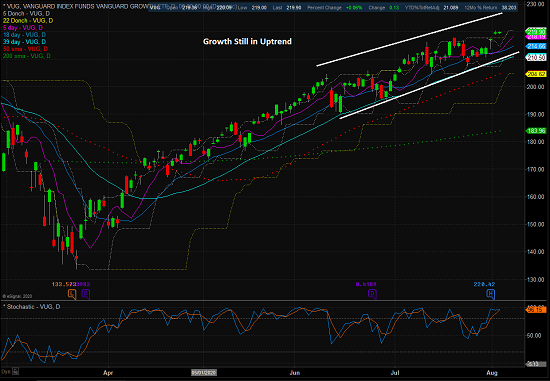
View Larger Chart
There can be little argument that growth stocks are in a confirmed uptrend and are not at all struggling with a sideways trading range.
So, from my seat, the answer to today's question depends on which "market" you are looking at. If you are focused on the COVID winners and the growth-oriented names, then the trend is up and there is nothing to do.
However, if you are focused on the other indices that are more economically sensitive, well, it's a different story. And until a medical solution to the virus begins to appear on the horizon or the U.S. successfully supresses the spread of the darn thing, this story is unlikely to change.
The State of Market Momentum
Once we've reviewed the state of the trend board and the action on the charts, we then analyze the internals to determine if there is any "oomph" behind the current trend via our group of market momentum indicators/models.
The is one change to report on the Momentum Board as our short-term trend and breadth confirm model upticked to positive. However, this is a very sensitive set of indicators that has been flip-flopping between positive and negative on a regular basis for the past month or so. All in, I'll score the board as moderately positive, which is in keeping with the struggle currently playing out in the major indices. The bottom line is I'd like to see our intermediate-term breadth model turn green before getting too excited about another meaningful leg higher.
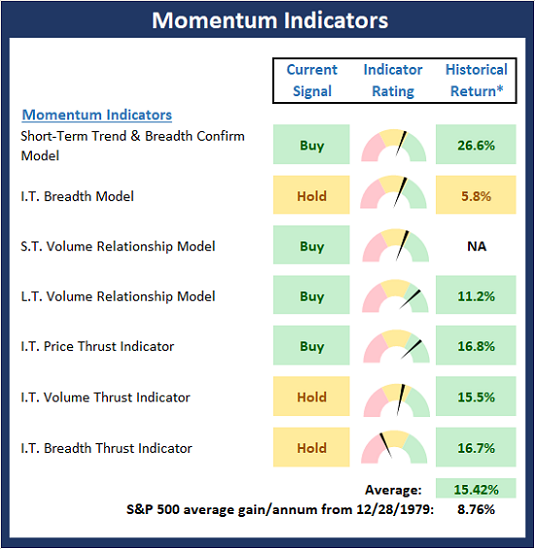
* Source: Ned Davis Research (NDR) as of the date of publication. Historical returns are hypothetical average annual performances calculated by NDR. Past performances do not guarantee future results or profitability - NOT INDIVIDUAL INVESTMENT ADVICE.
View Momentum Indicator Board Online
The Bottom Line
The trend is up and the market leaders continue to move from the lower left to the upper right on the charts. Momentum is "pretty good" but could be better. Therefore, my plan is to (a) continue to give the bulls the benefit of any doubt, (b) overweight the leaders/growth stocks, and (c) keep some powder dry in the event that the bears can muster a test of the lower depths of the range.
Thought For The Day:
"It isn't the size of the man in the fight; it is the size of the fight in the man." --Bob Fitzsimmons
Disclosures
At the time of publication, Mr. Moenning held long positions in the following securities mentioned: VUG - Note that positions may change at any time.
Trend Models Explained
Short-Term Trend Model: A series of indicator designed to identify the status of the stock market’s short-term (0-3 weeks) trend. The model compares the current price of S&P 500 relative to 5-day customized smoothing (weighted and moved forward 3 periods), the relationship of the 5-day to the 10-day, and the relationship of 10-day to 39-day.
Short- and Intermediate-Term Channel Breakout Systems: The short-term and intermediate-term Channel Breakout Systems are modified versions of the Donchian Channel indicator. According to Wikipedia, "The Donchian channel is an indicator used in market trading developed by Richard Donchian. It is formed by taking the highest high and the lowest low of the last n periods. The area between the high and the low is the channel for the period chosen."
Intermediate-Term Trend Model: A model designed to identify the status of the stock market’s intermediate-term (3 weeks to 6 months) price trend. The model compares the current weekly price of S&P 500 relative to relative to customized 10-week smoothing (weighted and moved forward 3 periods), the relationship of the 10-week to the 30-week, and the relationship of 30-week to 55-week.
Long-Term Trend Model: An indicator designed to identify the status of the stock market’s longer-term (>6 months) trend. The indicator compares the 50-day smoothing of the S&P 500 relative to its 200-day smoothing. When the 50-day is above 200-day, the indicator is positive and vice versa.
Cycle Composite Projections: The cycle composite combines the 1-year Seasonal, 4-year Presidential, and 10-year Decennial cycles. The indicator reading shown uses the cycle projection for the upcoming week.
Short- and Intermediate-Term Trading Mode Models: These indicator attempt to identify whether the current market action represents a "trending" or "mean reverting" environment. The indicator utilizes the readings of the Efficiency Ratio, the Average Correlation Coefficient, and Trend Strength models.
Momentum Models Explained
Short-Term Trend-and-Breadth Model: History shows the most reliable market moves tend to occur when the breadth indices are in tune with the major market averages. When the breadth measures diverge, investors should take note that a trend reversal may be at hand. This indicator incorporates an All-Cap Dollar Weighted Equity Series and A/D Line. At the time of this writing, when the A/D line has been above its 5-day smoothing and the All-Cap Equal Weighted Equity Series is above its 25-day smoothing, the equity index has gained at a rate of +26.5% per year since 1980. When one of the indicators is above its smoothing, the equity index has gained at a rate of +14.5% per year. And when both are below, the equity index has lost over -20% per year.
Intermediate-Term Breadth Model: A proprietary diffusion index developed by Ned Davis Research. The indicator is designed to determine the technical health of the market’s 157 sub-industry groups (GICS categorizes the market into 11 sectors, 20 industries, and 157 sub-industry groups). Technical health is determined by the direction of each sub-industry’s long-term smoothing and the rate of change of the sub-industry’s price index.
Short- and Long-Term Volume Relationship Models: These models review the relationship between "supply" and "demand" volume over the short- and intermediate-term time frames.
Intermediate-Term Price Thrust Model: This indicator measures the 3-day rate of change of the Value Line Composite relative to the standard deviation of the 30-day average.
Intermediate-Term Volume Thrust Model: This indicator uses NASDAQ volume data to indicate bullish and bearish conditions for the NASDAQ Composite Index. The indicator plots the ratio of the 10-day total of NASDAQ daily advancing volume to the 10-day total of daily declining volume. The indicator supports the case that a rising market supported by heavier volume in the advancing issues tends to be the most bullish condition, while a declining market with downside volume dominating confirms bearish conditions.
Breadth Thrust Model: This indicator uses the number of NASDAQ-listed stocks advancing and declining to indicate bullish or bearish breadth conditions for the NASDAQ Composite. The indicator plots the ratio of the 10-day total of the number of stocks rising on the NASDAQ each day to the 10-day total of the number of stocks declining each day. Using 10-day totals smooths the random daily fluctuations and gives indications on an intermediate-term basis. Historically, the NASDAQ Composite has performed much better when the 10-day A/D ratio is high (strong breadth) and worse when the indicator is in its lower mode (weak breadth). The most bullish conditions for the NASDAQ when the 10-day A/D indicator is not only high, but has recently posted an extreme high reading and thus indicated a thrust of upside momentum. Bearish conditions are confirmed when the indicator is low and has recently signaled a downside breadth thrust.
The ALL-NEW 2020 Daily Decision Model Portfolio
Current Positions and Performance Update
Below are the current positions for the 2020 Daily Decision Model Portfolio as well as an update on year-to-date performance through yesterday's close.
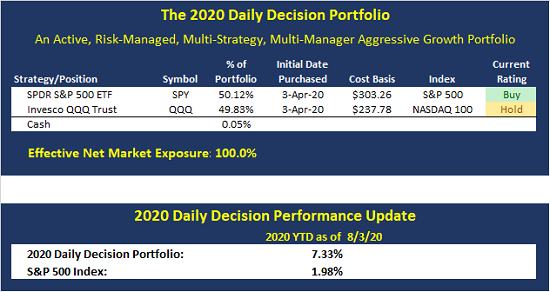
About The Portfolio: The Daily Decision Model Portfolio is an aggressive, actively risk-managed, multi-strategy, multi-manager approach. The primary objective of the portfolio is to stay in tune with the major market cycles - both bull and bear. However, the portfolio will, at times, actively manage exposures based on shorter-term moves. In addition to "timing" moves, the portfolio will utilize levered positions via ETFs and may hold an effective net short position during negative cycles.
Strategy Diversification: The 2020 DD Portfolio utilizes a well diversified approach. The management strategy incorporates multiple trading strategies so as to avoid the "singular failure" problem that can occur when a single strategy is out of sync. There are a total of 9 different trading strategies working in the 2020 DD Portfolio. Three "turbo-charged" aggressive beta strategies. Three mean reversion strategies. And three risk-management strategies. In addition, there are three separate managers working in the portfolio.
An Actively Traded Approach: We anticipate the portfolio will trade 2-3 times a week and hold between two and four ETF positions. Finally, please note that the Daily Decision Portfolio strategy is aggressive in nature and thus, drawdowns can and will occur. However, we believe the strategy will rebound quickly after temporary pullbacks.
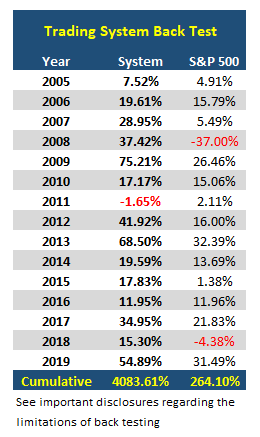
Testing The Trading Systems
In my humble opinion, it would be foolish to utilize any trading approach without first testing the strategy. However, when you combine strategies that have never been combined before, you have a hypothetical strategy. As such, you must do a back test on the combination.
There is a well known saying in the investment management business relating to hypothetical tests of trading systems that goes a little something like this: "Back tests are bull*#$!"
To be sure, there are problems involved with back testing, not the least of which is curve fitting. I.E. making your system fit the data provided. This is what happens when inexperienced traders try to develop systems that would have done well historically.
However, our approach here is different. We aren't using back testing to develop strategies to trade the market. No, we are testing a combination of EXISTING systems in effort to create "proof of concept." In other words, does a certain combination of systems developed by different managers work well together over time?
Wishing You All The Best in Your Investing Endeavors!
The Front Range Trading Team
NOT INVESTMENT ADVICE. The analysis and information in this report and on our website is for informational purposes only. No part of the material presented in this report or on our websites is intended as an investment recommendation or investment advice. Neither the information nor any opinion expressed nor any Portfolio constitutes a solicitation to purchase or sell securities or any investment program. The opinions and forecasts expressed are those of the editors and may not actually come to pass. The opinions and viewpoints regarding the future of the markets should not be construed as recommendations of any specific security nor specific investment advice. Investors should always consult an investment professional before making any investment.
Important Disclosures Relating to the Limitations of Back Testing:
The preceding summary of hypothetical performance is for illustrative purposes only and is not a solicitation or recommendation of any investment strategy.
There is no guarantee that investment results portrayed in this illustration will yield similar future results. All investments and/or investment strategies involve risk including the possible loss of principal. Consult an investment professional before investing in any investment program.
In the illustration we have utilized hypothetical back testing to create the performance record to reflect the manner in which an account could be managed. Hypothetical back tested performance results have many inherent limitations and do not reflect the actual results of any client account.
Hypothetical performance results are achieved by means of the retroactive mixing of portfolio strategies that was designed and prepared with the benefit of hindsight. No representation is being made that any strategy will or is likely to achieve profits or have losses similar to those shown. Hypothetical testing may not reflect the impact that any material market or economic factor may have on investment decision making. Further, the performance record in this illustration may have under or over compensated for the impact, if any, of certain market factors (e.g. lack of liquidity, trading costs, etc.). The conditions, objectives or investment strategies may have changed materially during the time period, or after the time period, portrayed in this performance record, and the effect of such change is not portrayed in the performance record.
Hypothetical back tested performance results are shown gross of management fees. Hypothetical back tested performance results are before trading and other custodian costs and do not consider the impact of taxes.
PAST PERFORMANCE IS NOT NECESSARILY INDICATIVE OF FUTURE RESULTS
Recent free content from FrontRange Trading Co.
-
 The Lines In The Sand Are Clear
— 9/16/20
The Lines In The Sand Are Clear
— 9/16/20
-
Portfolio Update: 1.23.20
— 1/23/20
-
State of the Markets: Modeling 2020 Expectations (Just For Fun)
— 1/13/20
-
Current Holdings for ALL-NEW 2020 Daily Decision Model Portfolio
— 1/03/20
-
INTRODUCING: The ALL-NEW Daily Decision Model Portfolio for 2020
— 1/03/20
