We all know that precious metals are in a vicious bear market. The Gold bugs have been the butt of jokes for a good 4 years now. At the time, they were the loudest and most obnoxious group we’ve seen in a long time. Go back and see what was being said back in 2010-2011 from the perma-bulls in metals. That sentiment unwind has been extremely powerful as Gold prices are now down 40% and Silver is down 70% from their 2011 highs. The Miners ETF $GDX which represents a basket of the companies in that space are down 80% from those highs hitting all-time lows just last week. It’s okay to be wrong, but at some point if the data suggests changing your mind, you better. No reason to keep the same narrative all the way down for years. That doesn’t make any sense.
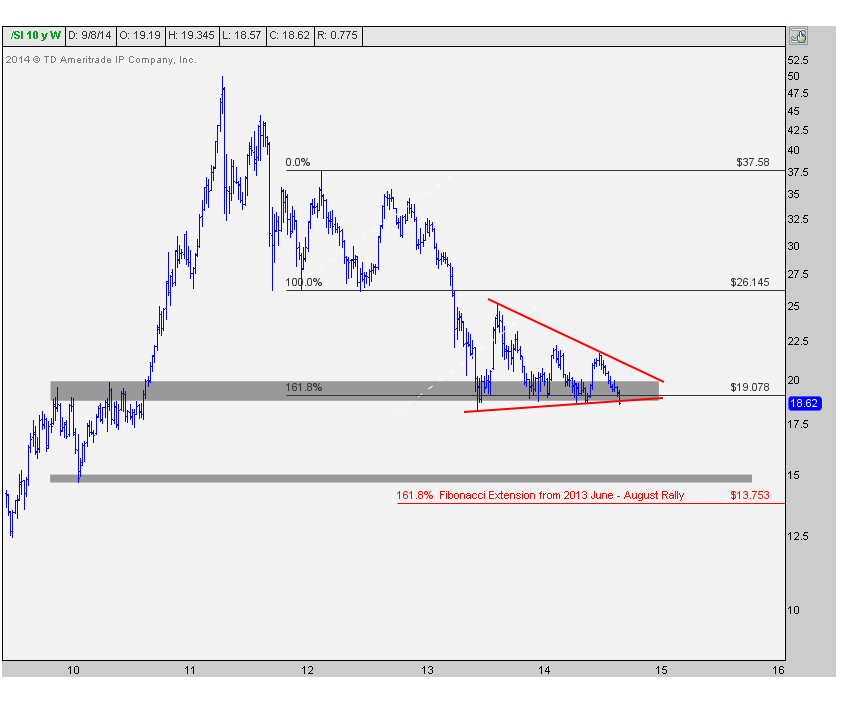
One of my favorite tells over the past few years for precious metals has been in the Silver market. This is the more volatile of these two and has been a great signal for a while now. A year ago when prices were around 18.60, we said that a breakdown was likely coming in Silver that would take us down another 20-25% under $15 and most likely under $14 (See: The Downside Target In Silver Is Below $15). These downside targets have all been hit over the past several months, but the lack of a significant bounce from down here is worrisome. Momentum is not putting in any bullish divergences and all signs are pointing to another leg lower. Think about this: even with Silver hitting new lows last month not seen since 2009, sentiment isn’t anywhere near the bearish extremes that we’ve seen at prior temporary lows the past 2 years.
This is the weekly chart that we were looking at a year ago showing prices hitting this support 4-5 times. The more times a level is tested, the higher the likelihood that it breaks. Sure enough, we broke down soon thereafter and prices came crashing down.
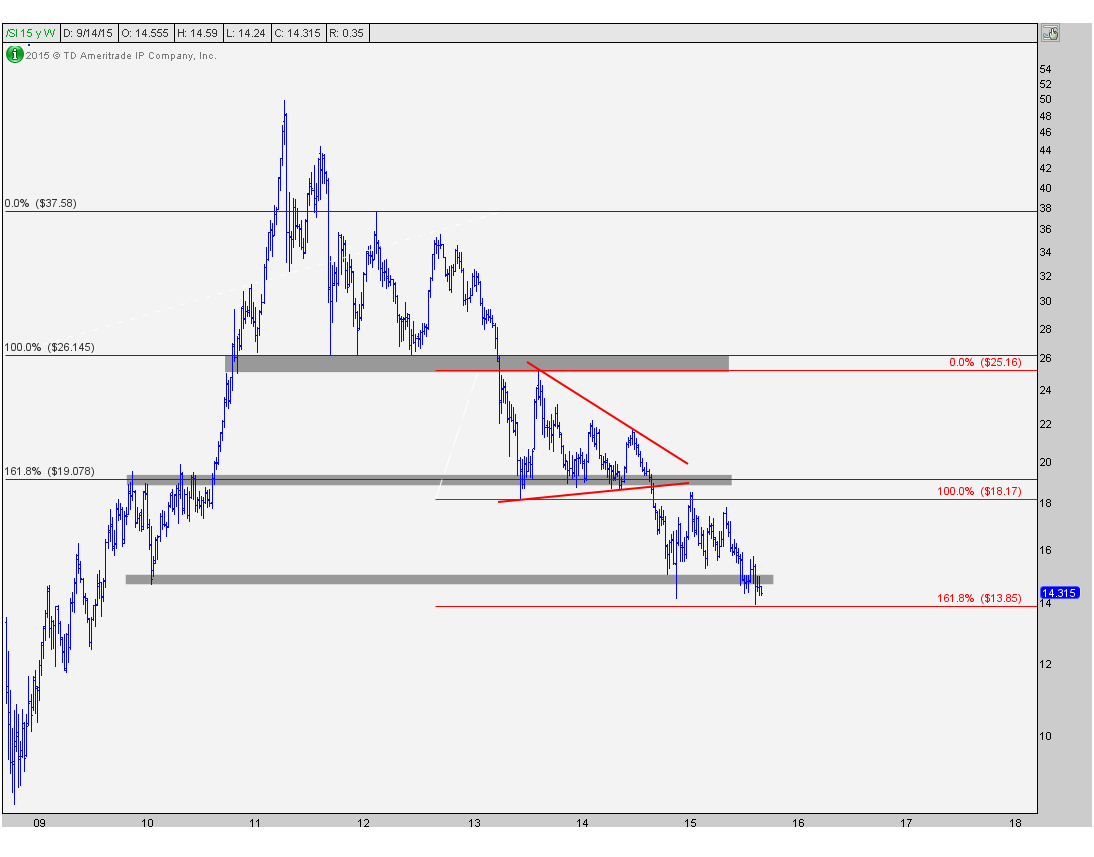
This is what that looks like today. You guys know I like my charts clean, and there’s a lot going on here, so bear with me. The black Fibonacci extensions with prices on the left represent our initial downside target that was hit in 2013. This was the 161.8% Fibonacci extension of the counter-trend bounce from 2011 to 2012. This combined with 4-5 tests of this level over the next year is why we felt this was such an important level and why a breakdown would be devastating. Shortly thereafter, we got the break we wanted and prices reached our next target between $14-15 that was based on a combination of former support from back in early 2010 and the 161.8% Fibonacci extension of the counter-trend rally in the summer of 2013. As you can tell, it’s when these levels cluster together that I really start to pay attention:
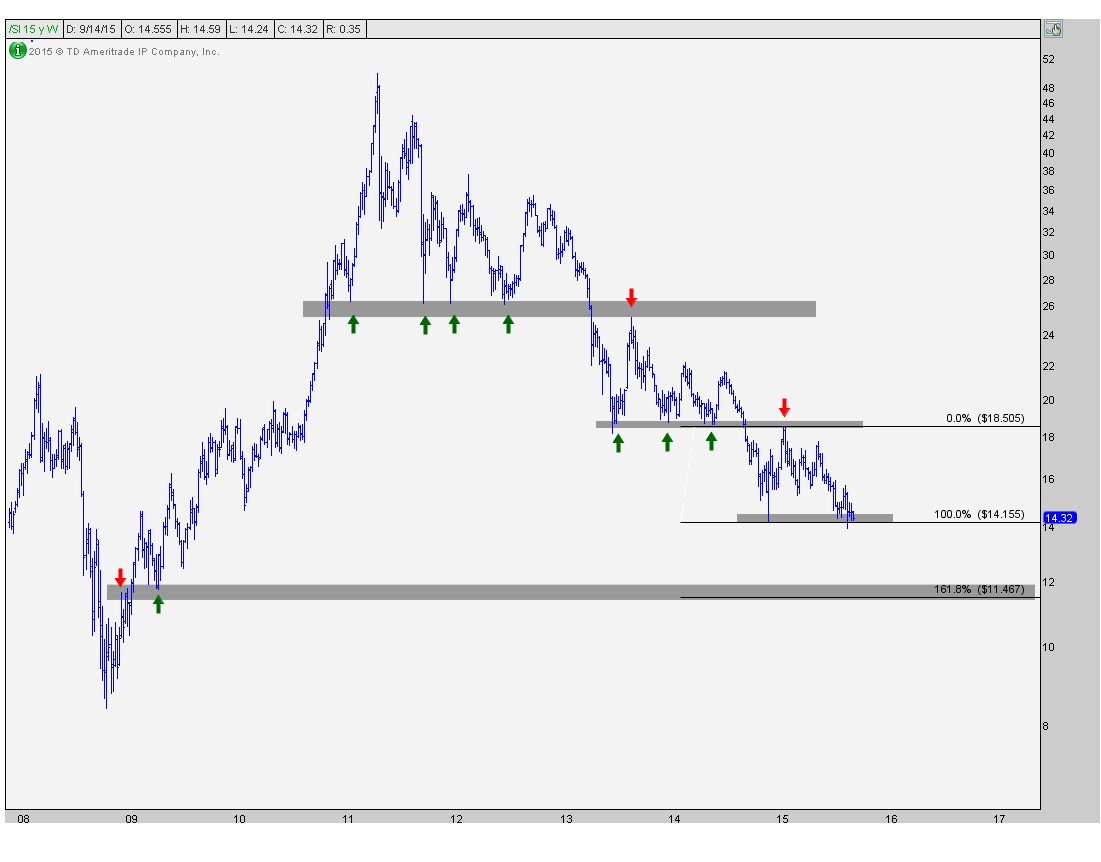
So if we’re going to use this exact same strategy that’s been working so well, we want to take the next level of support and combine that with the 161.8% Fibonacci extension target of the most recent counter-trend rally that took place in January of this year after hitting our initial downside targets mentioned above. This gives us a new target under $11.50 representing another 20% of downside from current levels.
From a risk management perspective, the strategy is the same as it’s been over the past 2 years. We only want to be short if prices are below the lows from this counter-trend consolidation, and more neutral if we are above it. The line in the sand is clear. Notice how when prices broke down in early 2013, that former support turned into resistance later in the year on that counter-trend move. The same thing happened earlier this year as the bounce was halted right at former support since 2013. I would expect the same to occur here in the future, if prices break down, hit our target and then bounce. But we’ll worry about that when the time comes.
I’m a weight-of-the-evidence guy. Everything I’m seeing points to a breakdown coming soon. If and when we get it, I think there’s another 20% of downside. Best of all, the market has given us a very well-defined line in the sand, which to us is the most important thing. Sure we can see another temporary bounce from here, but I think that will be met with more supply and eventually we break. We want to aggressively short that break.
***
REGISTER HERE to receive weekly updates on these Silver charts along with 16 more Commodities futures on multiple timeframes along with analysis on 10 of the major Currencies.
Recent free content from J.C. Parets
-
 Canadian Dollars Are About To Explode Higher
— 10/07/15
-
 Gold Looks Ready For Its Next Leg Lower
— 9/30/15
-
 Find Your Edge: The Autumn 2015 AlphaShark Trading Symposium with a Presentation by J.C. Parets
— 9/25/15
-
 Why Yen Is The Most Important Chart For US Stocks
— 9/17/15
-
 Here’s Why Energy Will Outperform Going Forward
— 8/31/15
-
{[comment.author.username]} {[comment.author.username]} — Marketfy Staff — Maven — Member


