

Preparing for the Week of May 18
Market Outlook
Last week we saw the repeat of the now-familiar price action: the market was weak in the early going and then rallied to finish the week strong.
The biggest difference was that, for the first time this year, the S&P 500 was able to cross and close the week above the 2120 level. This is a significant technical development in my opinion and signals that the market could be starting a broader move higher.
For the record, the rising bearish wedge I have been droning on about for months is still intact and the S&P price is still under the lower trendline.
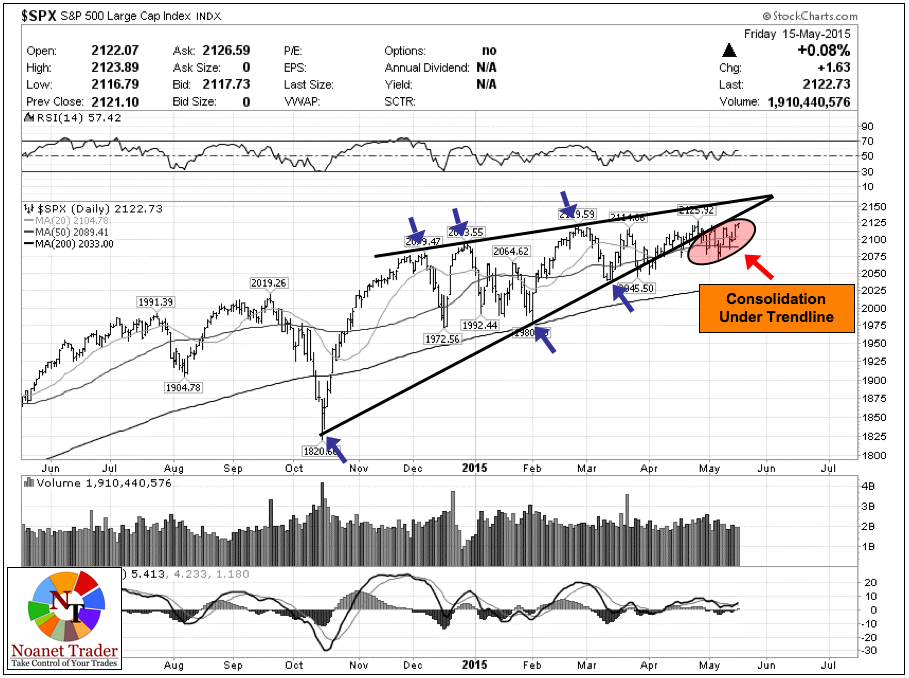
However, after repeatedly trying and then failing to make a serious dent in the current uptrend, the bears seem to have become exhausted last week and ready to throw in the towel.
Consequently, the S&P price structure has morphed into what now looks like an ascending triangle, a bullish pattern. Depending on how you visualize and draw the triangle you can arrive at a range of bullish scenarios. Below is possibly the most bullish one (I tweeted about it yesterday).
...
Please click HERE to read the rest of this article.
Enjoy your Sunday.
Recent free content from Noanet Trader
-
 Ignoring the Greco-German Noise
— 6/21/15
Ignoring the Greco-German Noise
— 6/21/15
-
June 18 Recap
— 6/18/15
-
All Eyes on the Russell
— 6/14/15
-
Preparing for June
— 5/31/15
-
Spooked by Negative Divergence?
— 5/13/15
-
{[comment.author.username]} {[comment.author.username]} — Marketfy Staff — Maven — Member

- 1 Campus Martius, Suite #200Detroit, MI 48226
- +1 877 440 9464