

Is John Deere Finally Ready To Break Out?
We are constantly looking through charts of stocks and commodities from all over the world. For the most part, there is nothing to really do with these charts and it’s generally just a few that stand out. One of the things we look for is a healthy consolidation. Some like to refer to these consolidations as “big bases”. When securities resolve after a lengthy consolidation, or base, the move that develops tends to be explosive and the new trends last longer than most.
Today I want to share what I consider to be one of the more impressive looking bases across markets. Specifically I am referring to John Deere. Here is a weekly bar chart showing $DE bumping up against this overhead supply in the $90s for almost 8 years. The way I see it, the more times that a level is tested, the higher the likelihood that it breaks through:
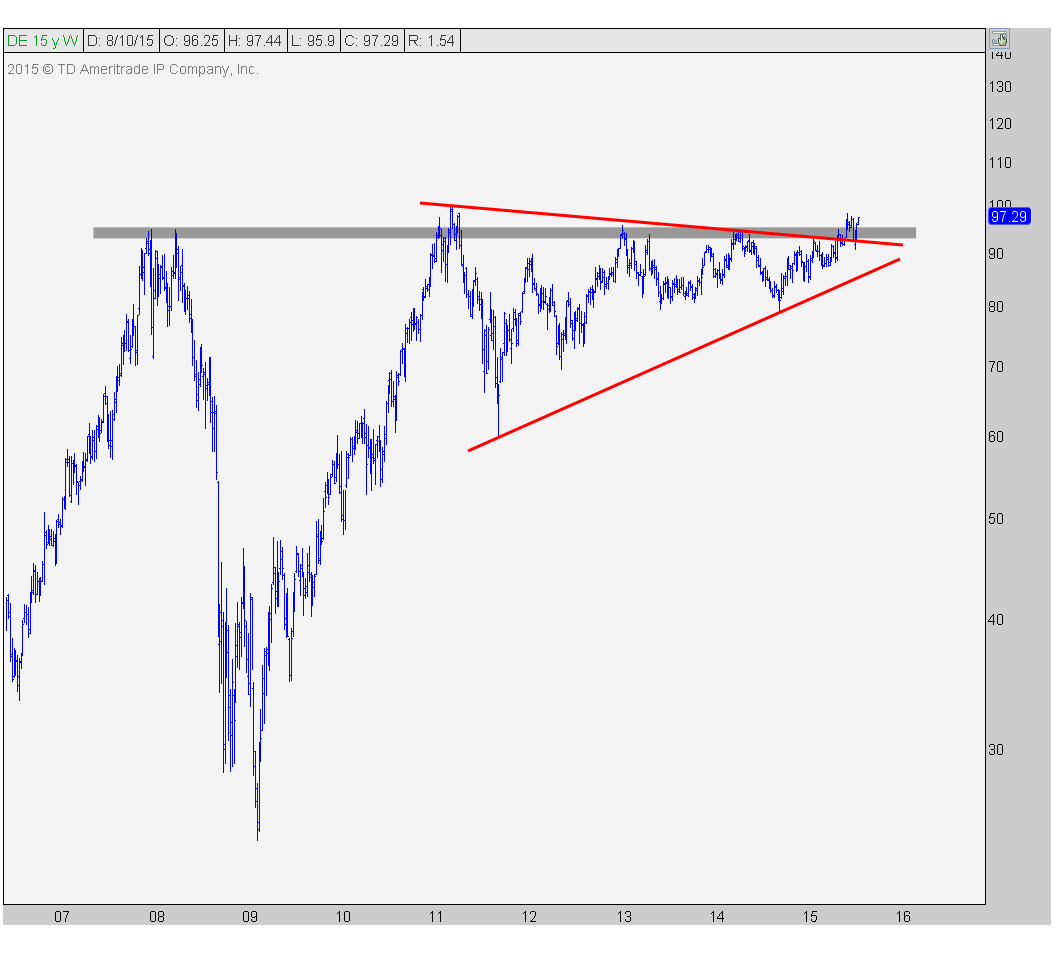
The overhead supply, or resistance, is not an exact level. It’s more of a range in the 90s. But in addition to the overhead supply shaded in gray, there is a fairly clean downtrend line from the all-time highs in early 2011. We’ve seen prices hold above this level over the past 6 weeks or so. I think this could be the start of something much bigger.
Price target-wise, there are a couple of levels that I am eying as the initial upside objectives. First of all, if we take just the size of the sideways range over the past 3 years (defined by the two parallel gray lines) we are looking at about 15 points from $80 to $95. This gives us an initial measured move target near $110. I would be taking profits up there tactically.
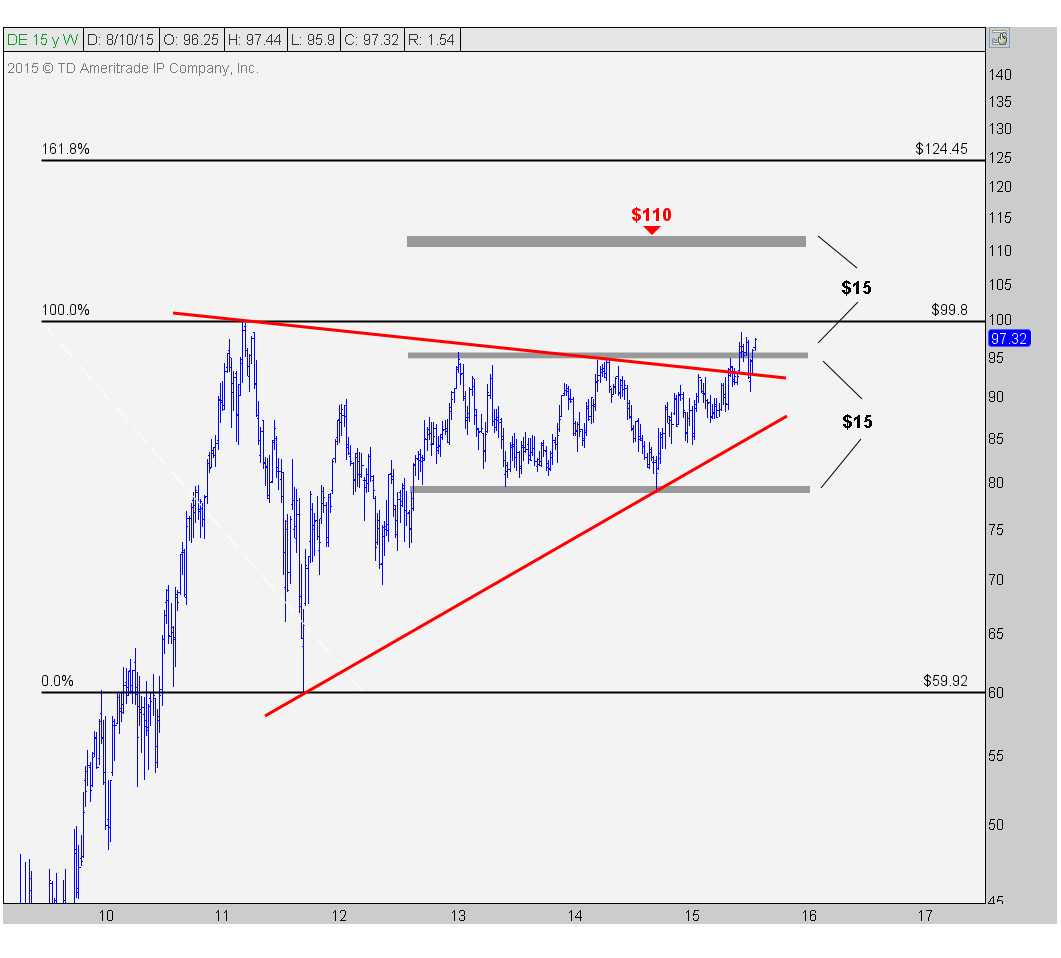
Looking a little bit longer-term, the 161.8% Fibonacci extension of this entire base since early 2011 is around $124 which gives us our ultimate target.
I think the best part of this setup is how well-defined the risk vs reward is heading in. We only want to be looking at this from the long side if prices are above all of this overhead supply defined by both the downtrend line from the 2011 highs as well as the upper end of this sideways range since late 2012. If prices are below those levels, I do not see any reason to mess with $DE on the long side. To me, the risk/reward here favors the bulls.
***
Click Here for more information on our Premium Technical Research Packages
Recent free content from J.C. Parets
-
 Miami This Week For The Finance Festival
— 11/04/15
Miami This Week For The Finance Festival
— 11/04/15
-
The Nasdaq Flirts With All-Time Highs
— 11/02/15
-
 Video: Technical Analysis Webinar by JC Parets
— 9/29/15
Video: Technical Analysis Webinar by JC Parets
— 9/29/15
-
Overhead Supply in Healthcare & Biotech
— 9/22/15
-
Thinking Out Loud Heading Into Q4
— 9/22/15
-
{[comment.author.username]} {[comment.author.username]} — Marketfy Staff — Maven — Member

- 1 Campus Martius, Suite #200Detroit, MI 48226
- +1 877 440 9464