

THE WEEKLY TOP 10
THE WEEKLY TOP 10
Table of Contents:
1) The indexes rallied last week, but a lot of money was lost. That’s not good for the stock market.
2) The most important development from last week was the ECB’s surprising change in policy.
3) Confirmation of an important change in trend for U.S. long-term interest rates.
4) The sovereign debt markets are not the only credit markets seeing lower prices and higher yields.
5) Updated support and resistance levels on the S&P 500 Index and the Nasdaq Composite.
6) We’ll be watching the action in Taiwan Semiconductor very closely going forward.
7) What will the XRT and XLY tell us about the consumer in the coming weeks?
8) The railroad group should be a good indicator for the economy going forward.
9) NFL owners could quickly lose their status as “big swinging dicks” in 2022.
10) Summary of our current stance. (Don’t fight the Fed…nor the ECB.)
1) Despite the fact that the S&P 500, the Nasdaq Composite and the Russell 2000 indices all finished last week with gains, it was not a good week for the stock market. We saw DRAMATIC moves in some big cap names. These were not small/thinly-traded names, so the fact that they moved so significantly is worrisome. When stocks sees massive one-day moves like we saw last week, it can only mean that a lot of leveraged players lost a lot of money last week. When big losses hit Wall Street, it always hurts the market further before long.
The moves in the stock market have really been something in recent weeks…and these wild moves have come in both directions. However, it does come close to comparing to the moves we’ve seen in individual stocks…especially in the last two weeks. In fact, the second half of this past week was particularly volatile. For instance, we saw GOOGL bounce 11%, FB fall 25%, SNAP trade 45% higher, AMZN 14% higher…and Ford drop by almost 10%.
The problem is that the only way that most of these stocks could possibly have moved THAT much in one or two days is because a lot of investors were got caught off guard. This is actually a nice way of saying that the only way these huge moves could have taken place over such a short period of time is if a lot of investors lost a lot of money…with both the longs and the shorts getting burned badly (depending on the stock). We have seen several headlines touting how certain hedge funds did very well in January. This is great, but it won’t be long before we hear more about other hedge funds who saw outsized losses recently. The same has got to be true for many other investors…including individual investors.
In other words, there is a lot more going on with these wild swings than just the fact that many analysts were dead wrong in their earnings forecasts for certain stocks. It shows that despite the January decline, there is STILL a lot of leverage in the system…and even though the S&P 500, the Nasdaq, and the Russell 2000 all moved higher on last week, it is safe to say that there were some big losses in the Street recently….…
This does not bode well for the intermediate-term potential for the stock market. When the market sees large swings…and a lot of different stocks see even wilder swings, it is not the sign of a healthy market! More importantly, when leveraged investors lose a lot of money, it always seems to have a (FURTHER) negative impact on the markets before long.

2) With the above-mentioned HUGE moves in several different individual stocks last week, the most important development of the week did not receive the attention they deserved. The ECB made a surprising shift to a more hawkish stance. This is a negative development (“don’t fight the ECB”)……Once investors move their focus back towards this important change in policy…and the impact it is having on global long-term interest rates…the stock market will resume its decline in our opinion.
It was interesting that the surprising shift in policy by the ECB did not get as much focus as we thought it would last week. Don’t get us wrong, it was something that was widely reported, but since it did not seem to impact the stock market immediately. People were more focused on other issues. (It’s hard to blame them. When was the last time a critically important company lost 25% of its value in just one day? As we said above, it’s not like Meta (FB) is some thinly traded small-cap stock that can see wild moves all the time! Sure, it’s a tech stock…and tech stocks can indeed see many outsized moves quite frequently. But a 25% move in just one day??? That’s amazing.) Therefore, it’s not a major surprise that this news was on the tip of everybody’s tongue on Thursday.
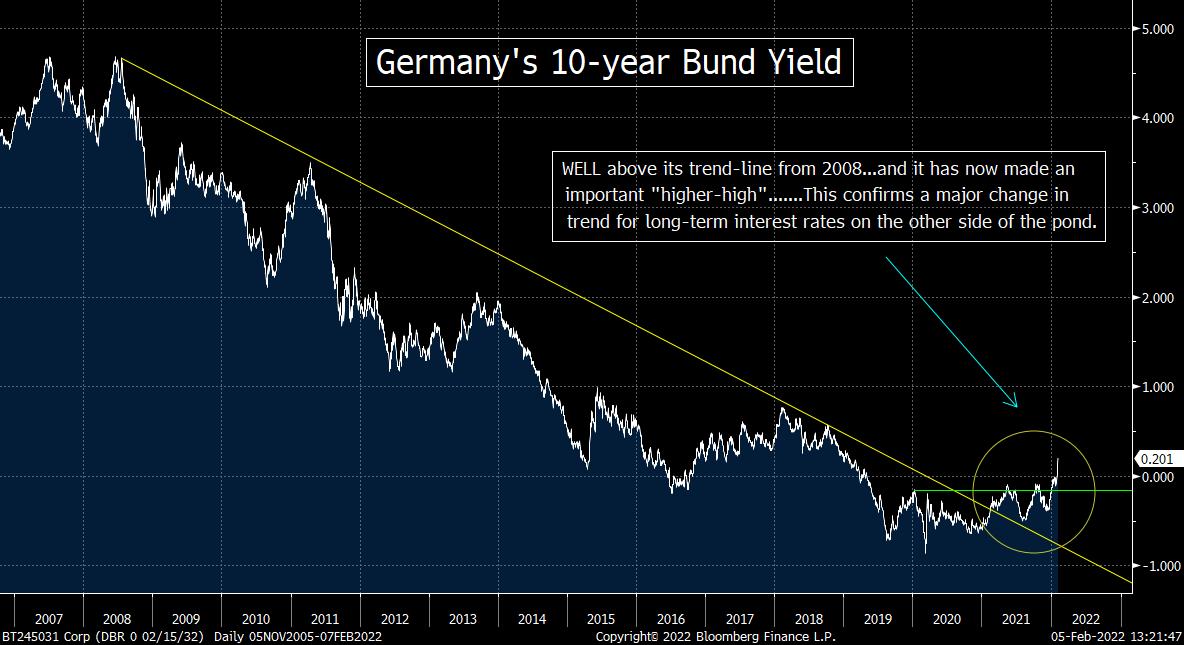
This IS a big change by the ECB. It’s funny, just last week we were saying that the ECB’s much less hawkish stance was helping the European stock markets outperform. Well, now that the Cristine Lagarde has gone from saying she did not expect any rates hikes at all in 2022…to strongly suggesting that a rate hike could come quite soon…it’s an entirely different kettle of fish. There is absolutely no question in our minds that this is an important shift in policy by the ECB…and given that the yield on the German 10-year bund rose 455% after the announcement was made, it sure looks like the markets see this announcement as an important shift in policy as well. (Okay, okay…that 455% number is a bit misleading. When you rise from 0.03% to 0.20%, it’s not quite as impactful as if the 455% rise has begun at a 5.0% level…but it’s STILL an important move.)’
In fact, the sharp move last week confirmed an important change in trend of the long-term trajectory of Germany’s 10yr bund yield. The move took it back into positive territory for the first time since 2019. We’d point out that the 10yr German yield is also above its trend-line going all the way back to 2008!!! The break above this trend-line actually took place early last year. However, the 10yr bund yield went back down and tested that trend-line later in the year…and then bounced strongly higher. This most recent rise also took the yield meaningfully above its highs from both 2020 and 2021! Therefore, not only has Germany’s 10yr yield broken well above its 12-year old trend line, but it has also made its first important long-term “higher-high” since God was a child! Therefore, investors need to wake up to the fact that we’ve seen a VERY important change in trend for long-term interest rates on the other side of the pond!
So now we have a situation where the Fed, the BOE and now the ECB all tightening their monetary policy. This is taking place at a time when China is clamping down on risk taking, leverage and debt. (Yes, the PCOB is easing their policy, but the gov’t is still clamping down…and this trend is likely to reassert itself after they’re done with the Winter Olympics based on what their leaders said late last year.)……With so many different spots around the world…moving from an EXTREMELY accommodative stance…to one where they are becoming much more restrictive…we don’t know how people can expect the (still) very expensive U.S. stock market to climb well above its all-time highs from the first day of trading of this year.
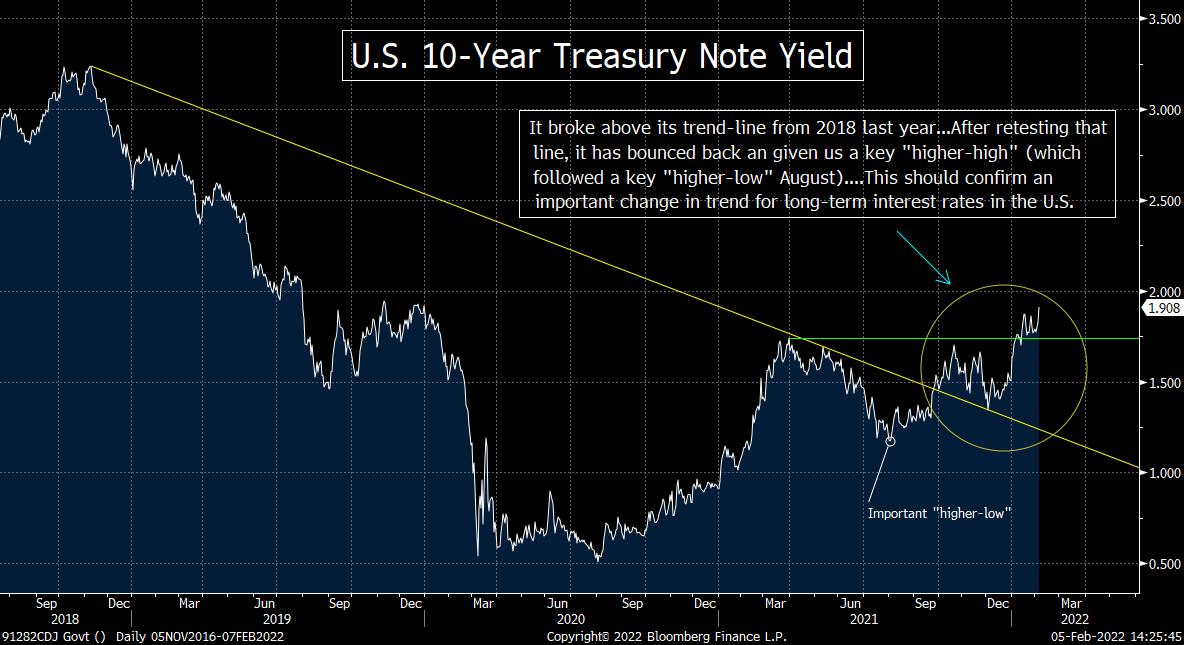
3) The news from the ECB (on Thursday) caused U.S. interest rates to rise a little bit on Thursday, but Friday’s much stronger-than-expected employment report shot them higher…and took them to their highest level for this move (and its highest level since 2019). More importantly, it took the U.S. 10yr yield well above its March 2021 highs (and above its recent mini “double-top” high). This “higher-high” signals that several very important sovereign debt markets are seeing important changes in trend. Since higher yields have an impact on the level of justifiable stock market multiples, this is not a positive development for the (very expensive) U.S. stock market.
The day after the ECB made their surprising announcement about their intentions when it comes to their short-term interest rates, the U.S. employment numbers came out (on Friday). These numbers were much stronger than expected…especially after a number of economists (and some members of the Biden administration) had set expectations very low earlier in the week…due to the omicron variant concerns. This surprisingly strong report led investors to believe that the Fed could be pretty much as aggressive as they’d like over the next month or two. It caused the Fed Funds Futures to price-in a rates hike at each of the next several meetings (and even gave it a 50/50 chance that they’re raise them before the March meeting). This, in turn, pushed long-term interest rates higher as well.
The yield on the U.S. 10-year note moved above 1.9% by the close on Friday. This means it has moved well above the March 2021 highs of 1.75%...and above its recent mini “double-top” high of 1.85%. As we have highlighted several times in recent months, the U.S. 10yr yield has already broken above its trend line going all the way back to 2018. It went back down and tested that line late last year. However, it bounced strongly off that line…and with its late-week move last week, it has followed last years important “higher-low”…with a very important “higher-high.” Therefore, the combination of upside break to a multi-year trend-line…and an important “higher-low/higher-high” sequence…it shows that an important change in trend for long-term interest rates in the U.S. has take place.
So there you have it. We are experiencing an important change in trend for long-term interest rates in both the U.S. and Europe. In our minds, this is a bigger problem for the U.S. stock market…for the simple reason that it is much more expensive than Europe’s market. Either way, once investors take their focus off of the crazy moves we saw last week in several individual stocks…and turn their focus towards the higher cost of money in our (still) overvalued and (still) overleveraged stock market…the stock market is very likely to roll back over.
4) We have some good news and some bad news about the rest of the credit market (outside the Treasury market). The good news is that if we see some serious stress in the credit markets, the Fed will almost certainly pivot (or at least slowdown) their tightening policy. The bad news is that if/when this kind of serious stress develops, the stock market is going to be a lot lower than it is now.
As we have highlighted ad nauseam over the past several months, the Federal Reserve did NOT “pivot” from their tightening policy in very-late 2018/very-early 2019 due to the decline in the stock market. In fact, when the S&P 500 was already down 12%-13% at their December 2018 meeting, the Fed went ahead and raise short-term interest rates yet again. If was not until some serious cracks developed in the credit markets that the Fed saw the need to stop tightening. In other words, the Fed did not care at all that the stock market was falling. In fact, given their comments about froth in the markets that summer, we would argue that they actually liked the fact that the stock market was finally “normalizing” along with interest rates. (We think it was one of their goals.) It was only when some serious stress developed in the credit markets…which signaled that the system was not yet strong enough to handle a deep correction in stocks…that the Fed pivoted in their policy.
Okay, so what is taking place right now? Well, we ARE starting to see some noticeable decline in bond prices away from the Treasury market. Both high yield corporate bonds and investment grade corporate bonds have seen some weakness. However, investors should not take this move as something that will cause the Fed to pivot quickly. In other words, these declines are not even close to something that would signal that some serious stress is developing in those credit markets. Therefore, these moves are something that are negative for the stock market…and certainly not positive.
We would also note that many people (like Jamie Dimon, for instance) believe that the system is much stronger than it has been in decades. If this is true, then the system can withstand a deeper decline in stocks and bonds than it has before. Of course, nobody should be hoping that a situation develops where some serious stress shows up in the credit markets. Yes, it WOULD cause the Fed to “pivot”…or at least slowdown…but that kind of development would only tell us that the system still remains very fragile more than a decade after the Great Financial Crisis. Besides, that would result in a much deeper decline in the stock market (much more than -20%) than if the system holds up well.
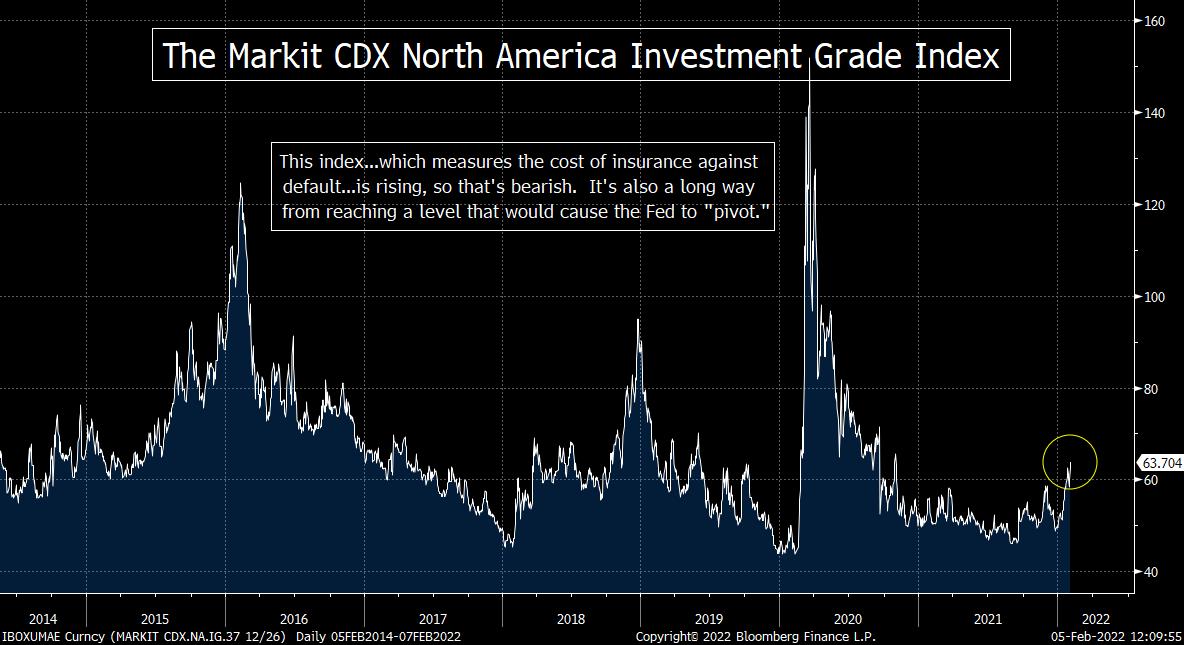
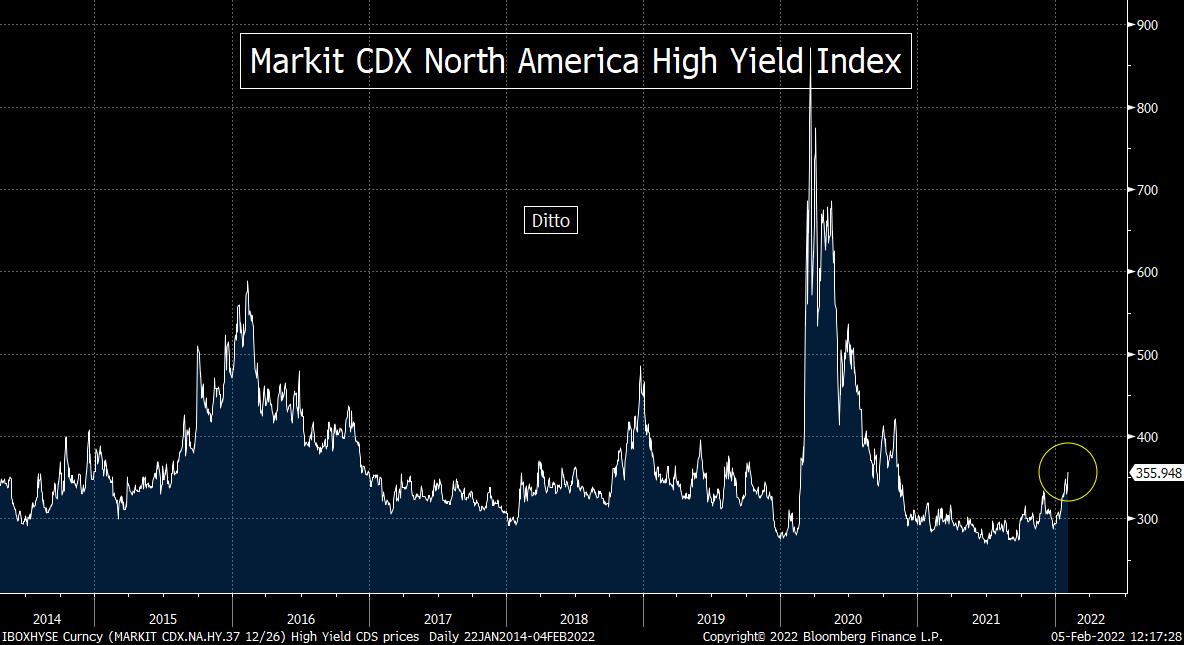
Our point is that the corporate bond market is seeing some problems…and this is another reason to worry that we’ll see “lower-lows” in the stock market in the coming months. As you can see from the charts below on the CDS prices for both high yield and investment grade corporate bonds (which measure the cost of insuring these bonds against default), the cracks in those markets are becoming noticeable. However, there are still WAY below their 2020 levels…and well below their levels from 2016 and 2018 as well. Therefore, we have a lot more room for these bonds to fall (and their CDS prices rise) before it signals that the Fed has to shift their policies once again.
In fact, if Mr. Dimon is right…and the system and the economy are strong enough to withstand the Fed’s new tightening policy, it’s actually bearish for the stock market. The issue of default will not become a problem as quickly as it did in late 2018 if the system is strong now…and thus the stock market will be able to fall further than it did back then……In fact, we remember what happened after the tech bubble burst. The S&P fell over 50% and the Nasdaq declined 80%, but the system was not put into peril. That said, given that now how over $11 trillion in corporate debt in the U.S., we do not think the Fed can let the stock market fall that far before they would change their tune. The odds that a lot of stress would show up before we reached a -50% decline are quite high. However, all of this still tells us that we can see a lot more pain in asset prices before the Fed feels the need to take their foot off the brakes…even if they won’t let it fall 50% again.
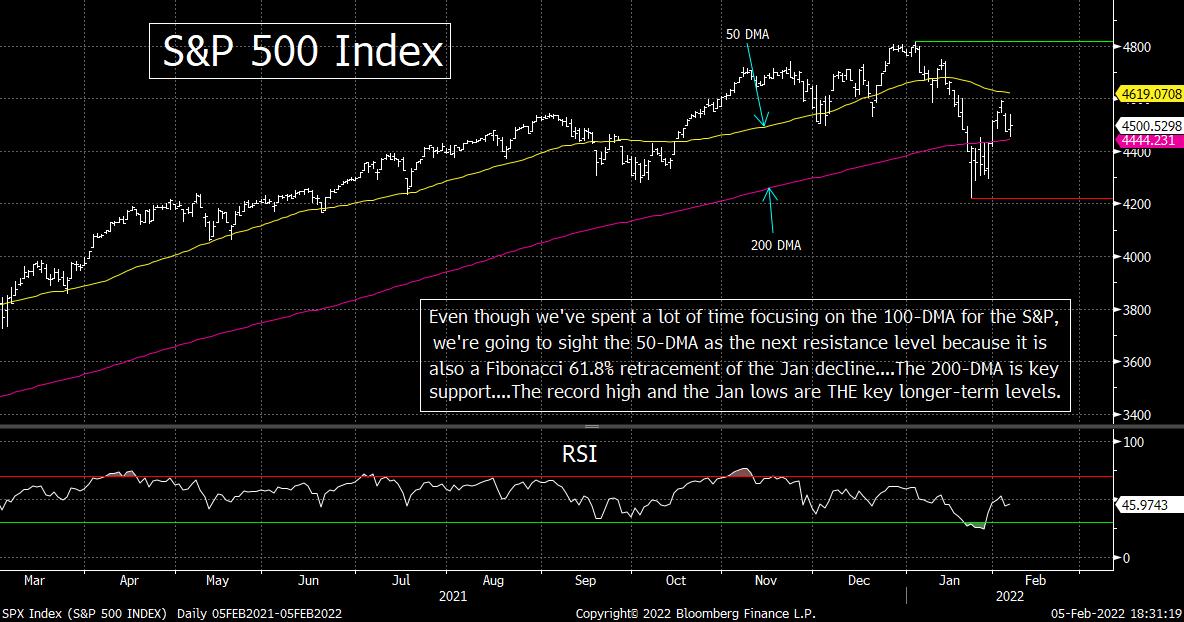
5) Okay, we’re at the midway point of this weekend’s piece, so let’s update the charts on the S&P 500, the Nasdaq. Needless to say, on a longer-term basis, the key resistance level is the all-time high for both indices…and the intraday lows from late January are the key support levels (which in this case are also the “line in the sand” levels). However, there are still some other support/resistance levels to be watching as we move deeper into the month of February.
We’ll start (as always) with the S&P 500…and we’ll sight the above-mentioned longer-term levels first. The all-time high resistance level for the S&P is 4,800…and the January intraday low support level is 4,222…….On top of this, we’ll be watching the 4,620 level as the next shorter-term resistance level to watch. That is where the 50 DMA comes-in…AND where the Fibonacci 61.8% retracement of the January decline comes in. As for support, we’ll be watching the 200-DMA. That line has provided very tough resistance the week before last, so that “old resistance” level becomes “new support”…and it comes in at 4,433……..However, since we’re so cautious on the stock market right now, we’ll reiterate that the 4,222 level is the all-important support level for whatever time frame you’re thinking about. (First chart below.)
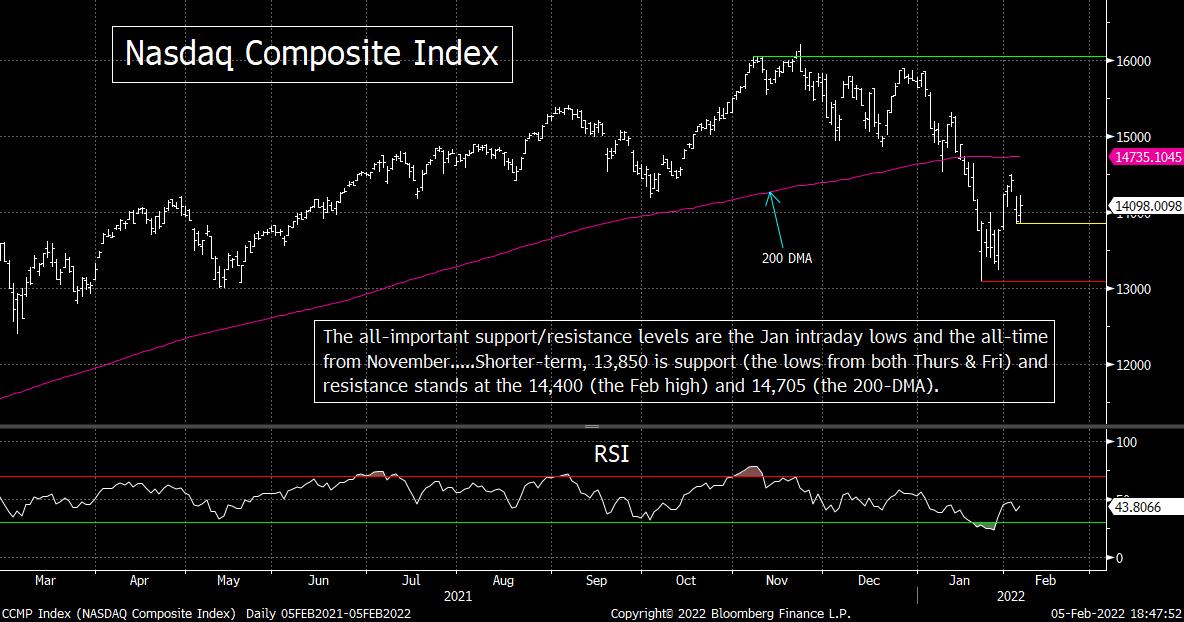
As for the Nasdaq Composite, the all-time high was just above 16,000, so that’s the key longer-term support level…and the January intraday low was 13,094. Any meaningful break above or below those levels would be a very, very, very important development on a technical basis….As for the other levels to watch between those levels, first resistance comes-in at 14,400. That was the closing high of last week…and a Fibonacci 38.2% retracement of the entire decline from its November record highs. Above that, we have the 200-DMA of 14,705…which is also almost exactly where the 50% retracement level comes-in……As for support, we have the 13,850 level. That was the low for the day on both Thursday and Friday, so any material break below that level would likely signal that it will retest those January lows of 13,094. (Second chart below.)
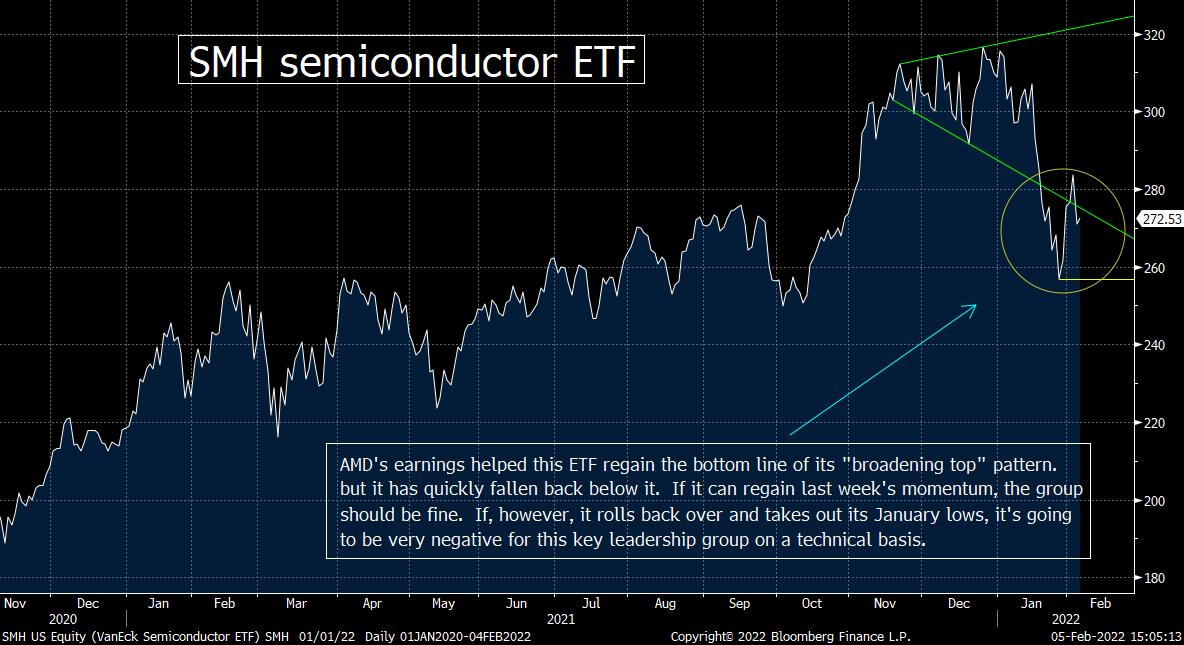
6) The chip stocks got a nice boost from AMD last week…when they reported better than expected earnings (along with a few others in the semiconductor group). This helped the SMH semiconductor ETF advance by more than 4% last week. However, it still closed back below the bottom line of its “broadening top” (“megaphone”) pattern by Friday’s close, so it’s not out of the woods…..We’d also note that the stock with the biggest weighting in the SMH…Taiwan Semiconductor TSM…doesn’t look all that great on its longer-term chart.
The chip stocks had a very rough January…as the SMH semiconductor fell more than 18% from January 3rd to Jan 27th. However, it was able to bounce from an oversold condition at the very end of last month…and that rally continued last week. The further bounce was fueled by a better-than-expected earnings report out of AMD (and some other chip stocks)…and this took the SMH back above the bottom line of the “broadening top” (“megaphone”) pattern that we have been highlighting recently. However, the chip ETF rolled back over a little bit late in the week. It still ended the week with a nice 4%+ gain, but it fell back below the lower line of that formation.
As we mentioned recently, “broadening top” formations are not very common. When they do take place, it is frequently a sign of an important top. This is especially true when the asset involved sees a significant break below that pattern…like the SMH did in January. However, we also said that if it could regain that pattern…AND rally further rather quickly…it would negate the negative move from last month. Well, AMD certainly helped the SMH…and if it can bounce back soon and regain the upside momentum it saw during much of 2021, everything will be fine. However, if the decline it saw late last week is the trend that continues…and the SMH takes out those January 27thlows in any significant way, it’s going to be VERY negative for this all-important leadership group.
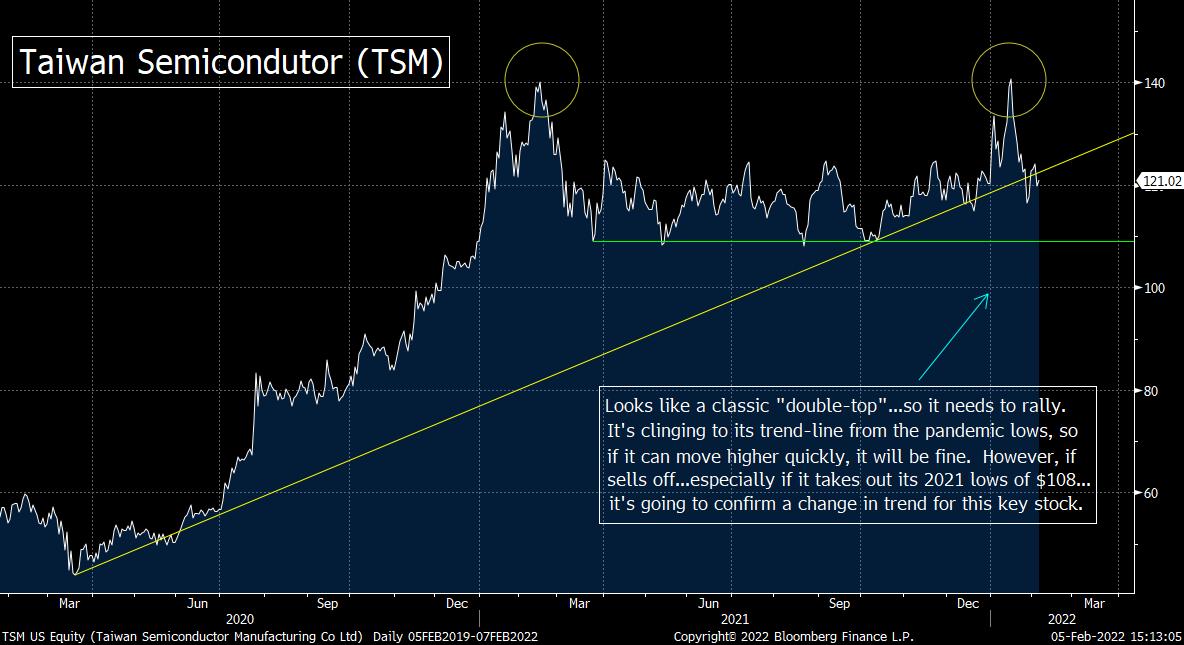
In order to decipher which way things will break for the SMH, we’ll be keeping a close eye on several stocks. Of course, AMD will still be a focus…as will stocks like NVDA, MU, QCOM and even INTC. However, we’ll also be watching the shares of the stock with the biggest weighting in the SMH…TSM. TSM had an unbelievable rally from mid-December to mid-January…with an astounding 22% run. However, that rally ended at the $140 level…and immediately gave back 90% of those gains in just two weeks. The $140 level was also the one that stopped a rally dead in its tracks for TSM back in early in 2021. Since the decline from that $140 level has been so fierce once again, it raises the question as to whether TSM has put-in an important “double-top.”
We’d also note that TSM has been bouncing off its trend-line from the March 2020 pandemic lows. So far, it has been able to hold that line. (Yes, it has broken slightly below that line a couple of times, but not enough to signal that its trend is changing quite yet.) However, if it does fall further in the coming weeks, it is going to raise the odds considerably that a “double-top” is indeed in place…and that TSM is going to face some problems on a technical basis.
Having said all this, we’d probably have to break below its 2021 lows of $108 to confirm a negative change in trend for this stock. That level is still almost 10% below where it’s trading right now. Therefore, we cannot say that TSM is at a critical juncture on a technical basis. However, if it breaks below its trend-line from the pandemic lows, it will certainly cause us to raise a yellow warning flag on the stock…and it will not be a good development for the rest of the group either.
Of course, there are a lot of geopolitical issues to consider when it comes to Taiwan Semiconductor. This could be especially true after the Winter Olympics are over. Therefore, this particular chart is not the only thing we’re all going to have to be aware of when it comes to the chip group in the weeks and months ahead. However, the fact that the most important stock in the SMH is sitting at the same level it stood 13 months ago (at the beginning of 2021) is something that does not give us as much confidence in the group as the consensus around Wall Street has right now.
7) We’re seeing a decent sized divergence developing between the employment picture and consumer confidence. You’d think that with the employment picture improving nicely, consumer confidence would be rising. However, consumer confidence has been falling for many months now. Looking at the charts of the XRT retail ETF and the XLY consumer discretionary ETF, there are reasons to think that this lack of confidence could have a negative impact on consumer spending at some point before too long.
As we all know by now, the employment number on Friday was much better than expected…with the non-farm payroll number coming in at +467k vs. the consensus estimate of just +125k. We also have the Fed declaring “mission accomplished” on the employment front, so you’d think that the consumer would be pretty confident right now. However, this is not the case at all. The University of Michigan Consumer Confidence data shows that consumer confidence stands at an eleven-year low!
There are several reasons to think why confidence is so low despite a strong employment back drop. The prices of basic items like food and gas have skyrocketed. The fatigue level on Covid…and everything that goes with it…is starting to skyrocket as well. Finally, it’s hard to have a lot of confidence when the President fumbles through every public appearance he partakes in…no matter which side of the political aisle one might stand……There are a lot of business leaders, political leaders, and economist who tell us that the economy will remain good, but all of them will admit that the consumer does not feel great in general right now.
Can the situation improve? Sure it can! This will be especially true if the pandemic issues subside. Many leaders are saying that we are going to move towards a situation where we “live with covid” in a more normal fashion. This could/should help people to get out more…to travel more…to spend more in general…especially as we move into the warmer months. That, in turn, could change consumer confidence rather quickly. However, right now, the charts on the XRT retail stock ETF and the XLY consumer staples ETF do not look very good. Therefore, if fears of inflation keep consumers from spending…even if things get better on the Covid front…it’s not going to be good for our consumer-based economy.
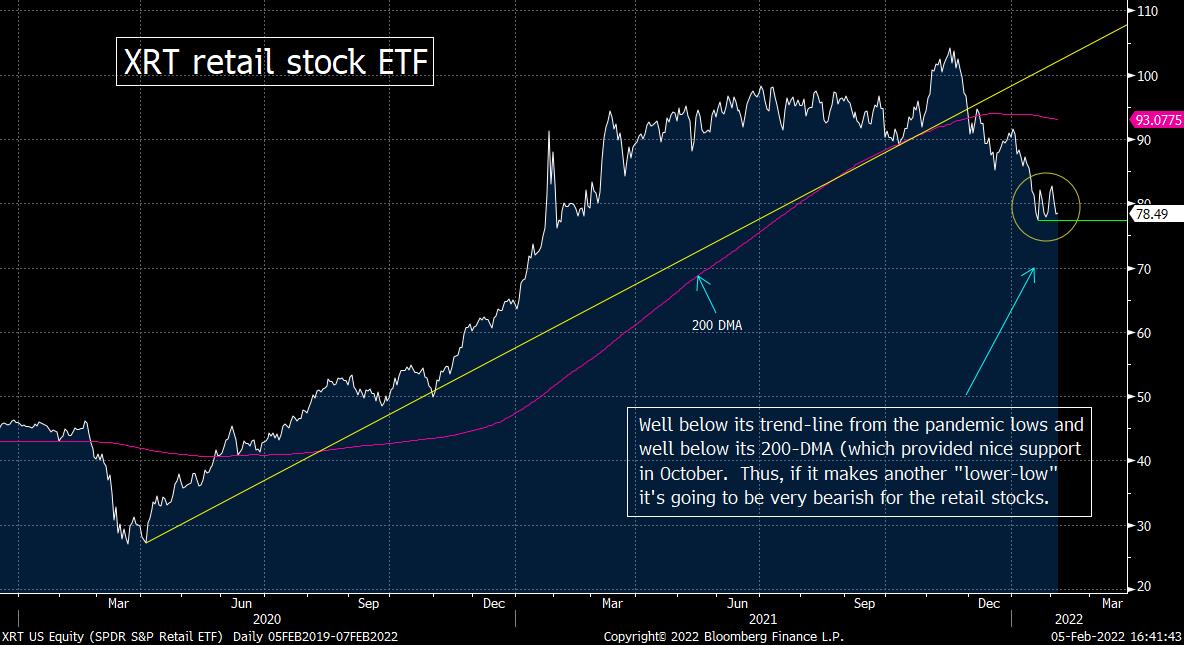
After what looked like a breakout rally back in the fall, the XRT has rolled-over in a significant fashion. It has declined almost 25% since its November highs…and stands only 1.5% above its January lows. This ETF fell below its trend-line from the March 2020 pandemic lows back in December…and has since fallen far below that line. The bounce off the January lows has been a feeble one, so if it breaks below those January lows, it’s going to be very negative for the retail stocks.
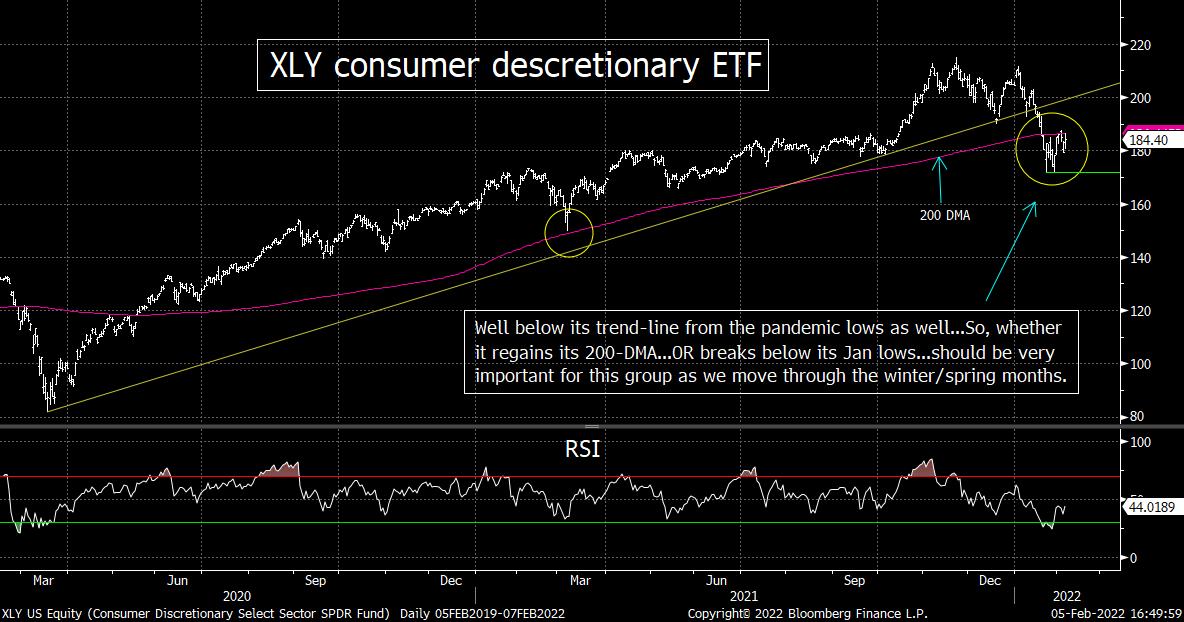
Of course, the retail stocks in-and-by-themselves are not as good of an indictor for the strength of the consumer as they used to be. However, the XLY consumer discretionary ETF is also seeing some material weakness. The decline from the November highs was “only” 17% for the XLY, so it did not perform as badly as the XRT during the rough decline. Also, it has bounced more strongly than the XRT, but its bounce has still been pretty feeble when you compare it to the broad market. (It has only retraced about 25% of its decline…vs. the S&P 500, which has retraced about 40%.) So, its action has still not been great…even though it has been a bit better than the XRT’s.
Looking at the chart on the XRT below, you can see that it has indeed fallen well below its trend-line from 2020. If falls below $77.25 in any meaningful way, it will also give us a second important “lower-low” since last year’s high…and thus it would be very bearish for the group on a technical basis……As for the XLY, it has also broken well below its trend-line from the pandemic lows. It has also broken below its 200-DMA (which provided excellent support in Q1 of last year). However, its most recent bounce has taken it back up near that moving average. If it can regain that line in a compelling manner, it will definitely give the sector some badly needed technical relief. If, however, it rolls back over and takes out is January lows of $174.30 in any material manner, it’s going to be quite bearish.
With all of this in mind, we’ll be keeping a close eye on these two consumer related ETFs. Their action over the coming weeks could/should be a good indicator about whether the consumer can regain some of the confidence it has lost over the last 6-12 months. Given how important the consumer is to the U.S. economy, it should also give us some insight about the level of economic growth we’ll see in the U.S. for the rest of this year.
8) Speaking of economically sensitive sectors, the DJ Transportation Index been a little weaker than the DJIA and the S&P 500. There is one important support level to keep an eye on in the weeks, ahead…and if it breaks below that level, it will send up warning flag on the economy. That said, some groups within this sector have fallen by differing degrees. Therefore, we will be watching the railroad stocks even more closely for clues about the strength or weakness in the U.S. economy going forward.
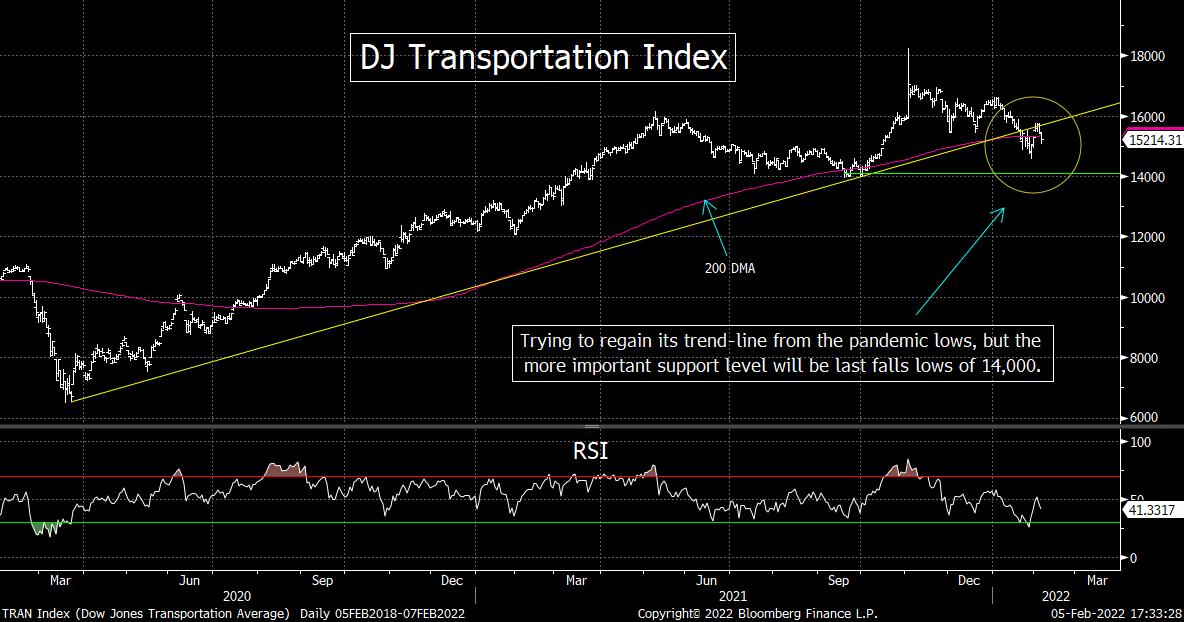
At the January lows, the DJ Transportation Index had fallen more than the DJIA and the S&P 500, but not as much as the Nasdaq or the Russell 2000. This economically sensitive index is something we always like to keep an eye on, so we wanted to check out the condition of its chart this weekend. The index has broken below its trend-line from the pandemic lows…and below its 200-DMA. However, it is only slightly below those lines this weekend. Therefore, it’s going to take a bigger decline for it to raise some a red flag on this economically sensitive sector…..If it breaks below its January lows of 14,800, it will raise our concerns. However, unlike many other assets, the January lows are not a ”line in the sand” level for the TRAN. That level comes-in at 14,000. It’s not just a round number, that was the low in late-September/early-October. Therefore, a break below that level would give the TRAN an important “lower-low”…and that would be quite bearish for the sector. (First chart below.)
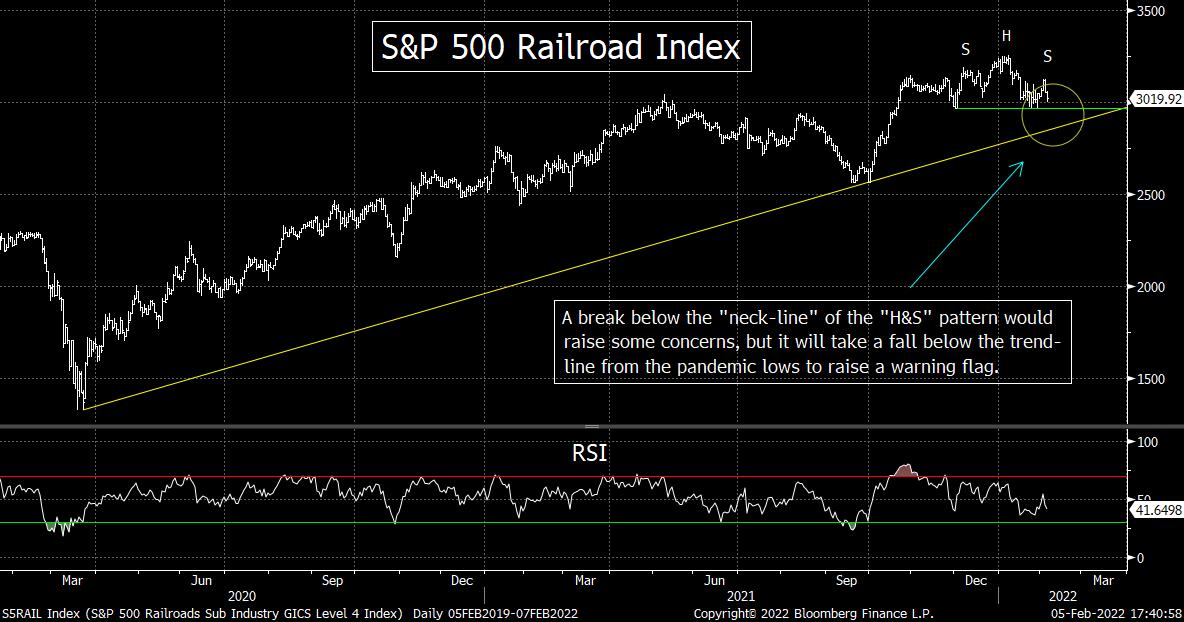
However, we all know that the airlines have been facing very unique issues over the last two years, so we also want to concentrate on the railroad stocks…which are a great indictor for the economy. At its worst level, the S&P railroad index fell less than 7%, so it has outperformed the broad market. It also stands WELL ABOVE its trend-line going back to the March 2020 pandemic lows. However, we do need to point out that it’s not far from the “neck-line” of an “head & shoulders” pattern. Therefore, if it breaks below the 2,960 level in any meaningful way, it could/should have so more downside potential…..That said, the trend-line from the 2020 lows does not come-in until the 2,870 level (which is still 6% below its current price), so the group has some room to maneuver)……In other words, the railroads are not at a critical juncture, but we will still be keeping an eye on them in the weeks and months ahead…to give us an idea of how well we can expect the U.S. economy to act over the rest of the year.
9) The Super Bowl is next weekend and once we get past that event, a lot of focus is going to move to the class action law suit being brought by former Dolphins Coach Brian Flores. Accusations of paying coaches to throw games to get into a better draft position…and the (poorly disguised) act of going through the motions when interviewing people of color for HC jobs…might be hard to prove. However, they won’t be hard to make them believable for most fans………The owners are likely going to face some big problems this year.
We loved how ESPN Star Steven A’s approached the issue of the abysmal record of hiring minority coaches in the NFL. Before he BASHED the owners for the pathetic job they’ve done on this front, he went out of his way to say that white coaches like Brian Daboll, Josh McDaniels, and others are very qualified to be head coaches in the NFL…and thus deserve to be head coaches. However, he then (CORRECTLY) went-on to filet the NFL owners for the embarrassing efforts they have made on this issue. In other words, Steven A is not looking for special consideration for ANYBODY. He just believes (again, correctly) that EVERY qualified person should get an equal chance at these jobs…something that obviously is not taking place. Race should not play a part AT ALL! (One other ESPN person…I forget whic
Recent free content from Matt Maley
-
 THE WEEKLY TOP 10
— 10/23/22
THE WEEKLY TOP 10
— 10/23/22
-
Morning Comment: Can the Treasury market actually give the stock market some relief soon?
— 10/21/22
-
What Do 2022 and 1987 Have in Common?
— 10/19/22
-
Morning Comment: Which is it? Is stimulus bullish or bearish for the stock market?
— 10/17/22
-
Morning Comment: Peak Inflation is Becoming a Process Instead of a Turning Point
— 10/13/22
-
{[comment.author.username]} {[comment.author.username]} — Marketfy Staff — Maven — Member

- 1 Campus Martius, Suite #200Detroit, MI 48226
- +1 877 440 9464