

The Daily Decision for 1.10.18 - Are Bonds Crossing the Line in the Sand?
The State of the Markets:
When stocks enter what I like to call "melt up" mode, everything is right with the world. The economic data is strong. Earnings are fantastic. Inflation is low. Consumers are happy and shopping. Employers are hiring. In short, things look good as far as the eye can see.
Having been in this business since 1980, I am happy to report that I've seen this movie before. What I've learned about this type of environment is it has a funny way of driving folks absolutely crazy - especially if they find themselves sitting on the sidelines, or worse yet, on the wrong side of the trend. And as I've mentioned a time or two lately, these joyrides to the upside tend to last longer than almost anyone can imagine.
However, once all the players are darn sure they've got the game nailed (meaning that everyone is fully invested) something crawls out of the woodwork to change the game. Something to put some fear back into the mix. Something to cause investors large and small to question their no-brainer thesis. Something that makes the "weak holders" decide that it's time to exit stage left.
While I don't want to be accused of being a "Debbie Downer" on this fine Wednesday morning, somebody's got to say it; the point is that this too shall pass at some point.
In my experience, the key is to be ready for that "something." To be ready for the game to suddenly change. Instead of waking up surprised to find the stock market in a downtrend and uttering the words, "Wait, what?" when looking at your portfolio, the trick is to make like a boy scout and be prepared.
For me, this means being on the lookout for that "something" to come crawling out of the woodwork. And while one day does not a trend make, I've got my eye on the state of the bond market here.
You see, the yield on the U.S. Government 10-Year made a break for the border yesterday. And while, the move may not wind up being a complete game-changer. It is definitely something to pay attention to.
As you can see from the chart below, the 10-year put in a breakout of sorts yesterday.
U.S. 10-Year Treasury Yield - Daily 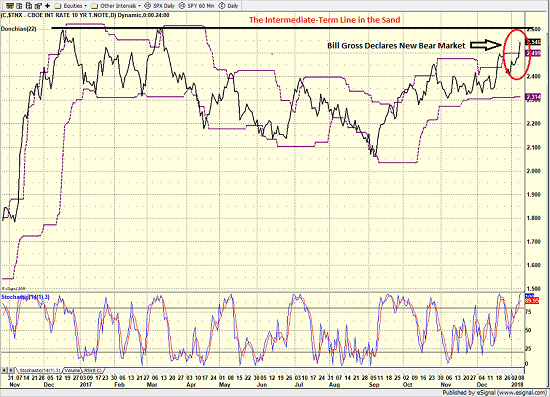
View Larger Image Online
There are two issues at work here. First is the concern that the Bank of Japan is about to reverse course on monetary policy. And to hear the bears tell it, if the BOJ starts down this road, the ECB will likely follow close behind. And with the U.S. Federal Reserve already in tightening mode, this would mark the beginning of the end for the QE era.
Oh, and then just to keep things interesting, former Bond King, Bill Gross, declared that bonds entered a bear market yesterday as the yield on the 10-year went through his 2.5% line in the sand.
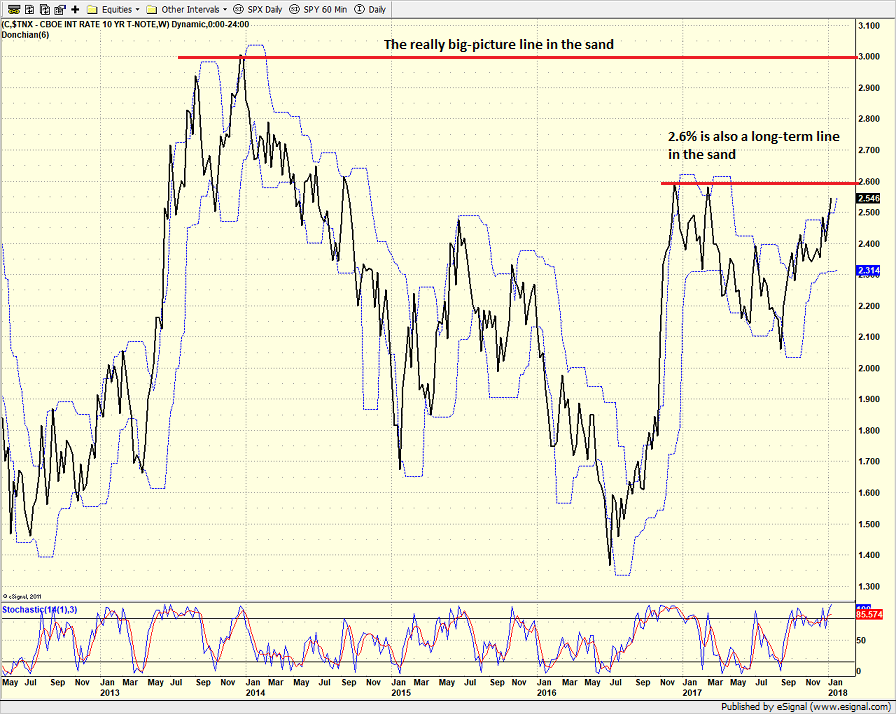
On that score, I will have to humbly disagree with Mr. Gross. While 2.5% may be the key for him, to me, 2.6% appears to be a more important level on both the short- and long-term charts. And from a secular basis, I'm going to say that 3.0% is the more important line in the sand.
U.S. 10-Year Treasury Yield - Weekly 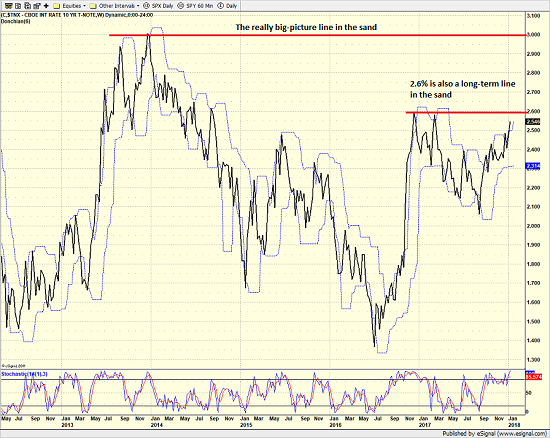
View Larger Image Online
However, as I fire up my machine this morning, I see that the 10-year is pushing higher and is currently trading at 2.59%. According to Bloomberg, officials in Beijing are planning to either slow or halt purchases of U.S. Treasuries going forward.
Some argue that China's comments represent political posturing in response to increasing trade tensions with the U.S.
The bottom line is that if bond yields continue to rise in a swift manner, they will begin to bite and stocks will suffer. And while this may not be the "something" that puts the brakes on the equity "melt up," I believe this remains "something" to watch here.
Thought For The Day:
Let a fool hold his tongue and he will pass for a sage. -Publilius Syrus
Today's Model Review:
LEADERS Model: The LEADERS currently holds positions in the Technology, Industrials, Health Care, and Financial sectors. We continue to look for an opportunity to make an adjustment to our holdings.
CORE Model (Risk Managed Exposure):
Today's CORE model's exposure is a bit above the current target at 90% vs. 70%. To review, the goal of this model is to stay in tune with the overall risk/reward environment. Therefore, we make adjustments only when there is a meaningful and sustained divergence between the target model reading and our current positions.
TRADING Model: We currently hold trades in the Russell 2000, India Small Caps, Eurozone, a dividend-payer ETF, and the emerging markets.
2018 YTD Performance Update:
DD LEADERS: +3.4%
DD TRADING: +3.2%
DD CORE: +3.1%
S&P 500: +2.9%
| Daily Decision Trading Service
Current Portfolio Summary | ||||||
| The LEADERS Model | ||||||
Position | ETF Symbol | % of Model | Date Purchased | Purchase Price | Current Rating | |
| Technology Select Sector SPDR | XLK | 25% | 12.1.16 | $46.64 | Hold | |
| Industrial Select Sector SPDR | XLI | 25% | 8.14.17 | $68.58 | Hold | |
| Health Care Select Sector SPDR | XLV | 25% | 11.27.17 | $81.79 | Hold | |
| Financial Select Sector SPDR | XLF | 25% | 12.12.17 | $28.19 | Buy | |
| The CORE EXPOSURE Model | ||||||
Position | ETF Symbol | % of Model | Date Purchased | Purchase Price | Current Rating | |
| ProShares UltraPro S&P (3X) | UPRO | 30.00% (Equiv 90% Long) |
Various | $98.78 | Hold | |
| The TRADING Model | ||||||
Position | ETF Symbol | % of Model | Date Purchased | Purchase Price | Current Rating | |
| iShares Eurozone ETF | EZU | 20% | 5.11.17 | $40.25 | Hold | |
| First Trust Value Line Dividend Fund | FVD | 20% | 5.11.17 | $28.88 | Buy | |
| iShares Emerging Markets ETF | EEM | 20% | 6.112.17 | $41.57 | Hold | |
| VanEck Vectors India Small-Cap Index ETF | SCIF | 20% | 7.18.17 | $58.00 | Hold | |
| iShares Russell 2000 ETF | IWM | 20% | 10.19.17 | $146.09 | Buy | |
% of Model Explained
The number shown in this column represents the percentage of the the model this position represents.
Current Rating Explained
This is our rating for the day. The Current Rating tells you what action we would take if we did not currently hold the position. A "Buy" rating means we would be willing to purchase the position at current prices. A "Strong Buy" suggests this would be our first choice to buy. A "Hold" rating indicates we would not make new purchases at current levels. And a "Sell" rating indicates we will likely exit the position in the near-term.
Positions Can Change
Positions often change during the trading session. Remember that we will send a Trade Alert via SMS Text Message and/or Email BEFORE we ever make a move in the models.
About the Daily Decision Models:
The Daily Decision is designed to be a simple, easy-to-follow e-letter service showcasing 3 different model portfolios. The LEADERS model is the flagship, growth oriented strategy that focuses on "where the action is" in terms of market leadership. The CORE model is a longer-term, risk-managed approach to keeping exposure to market risk in line with prevailing conditions. And as the name implies, the TRADING model is intended to be a tactical, opportunistic trading strategy.
Wishing You All The Best in Your Investing Endeavors!
The Front Range Trading Team
Daily Decision Links:
Daily Decision Resource Page
Interactive Performance Details
NOT INVESTMENT ADVICE. The analysis and information in this report and on our website is for informational purposes only. No part of the material presented in this report or on our websites is intended as an investment recommendation or investment advice. Neither the information nor any opinion expressed nor any Portfolio constitutes a solicitation to purchase or sell securities or any investment program. The opinions and forecasts expressed are those of the editors and may not actually come to pass. The opinions and viewpoints regarding the future of the markets should not be construed as recommendations of any specific security nor specific investment advice. Investors should always consult an investment professional before making any investment.
Recent free content from FrontRange Trading Co.
-
 The Lines In The Sand Are Clear
— 9/16/20
The Lines In The Sand Are Clear
— 9/16/20
-
The Question of the Day
— 8/04/20
-
Portfolio Update: 1.23.20
— 1/23/20
-
State of the Markets: Modeling 2020 Expectations (Just For Fun)
— 1/13/20
-
Current Holdings for ALL-NEW 2020 Daily Decision Model Portfolio
— 1/03/20
