

Weekend Review and Watchlist
Overview
An extraordinary week for the market which continued to correct in dramatic fashion, only to bounce even harder and finish higher.
Let's start with our 'Correction Roadmap' chart of the $SPX:-
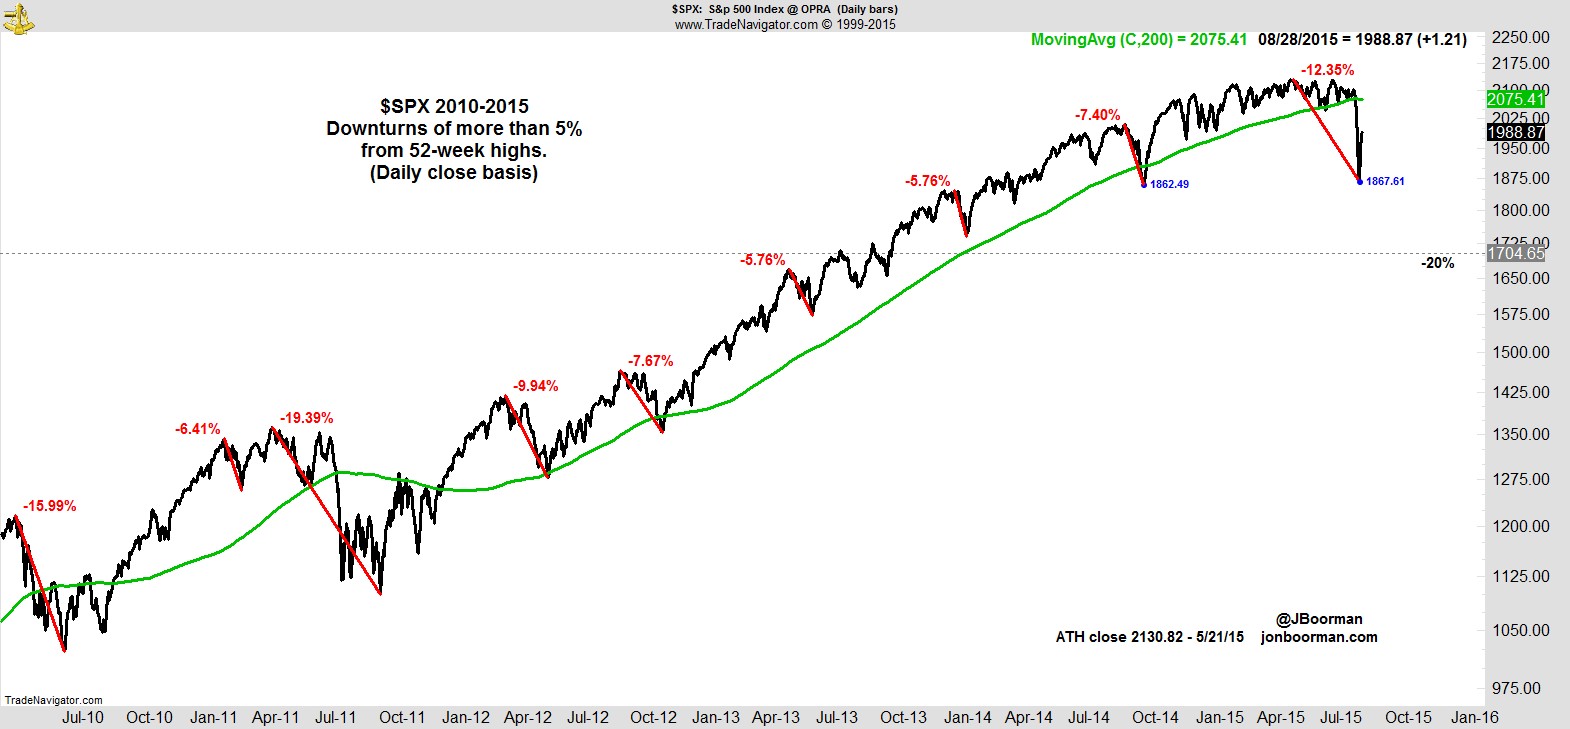
I normally keep the current move dynamic, as obviously until we reach new highs we can't know a downturn is over, but I've marked it at Tuesday's low close to show the maximum so far. That's a 12.35% decline, which makes it the third largest pullback since the 2009 lows, and the largest since 2011. As of Friday's close, it's 6.66% off the highs.
That line chart doesn't do justice to the volatility though. Here's the weekly chart followed by the daily using candlesticks.
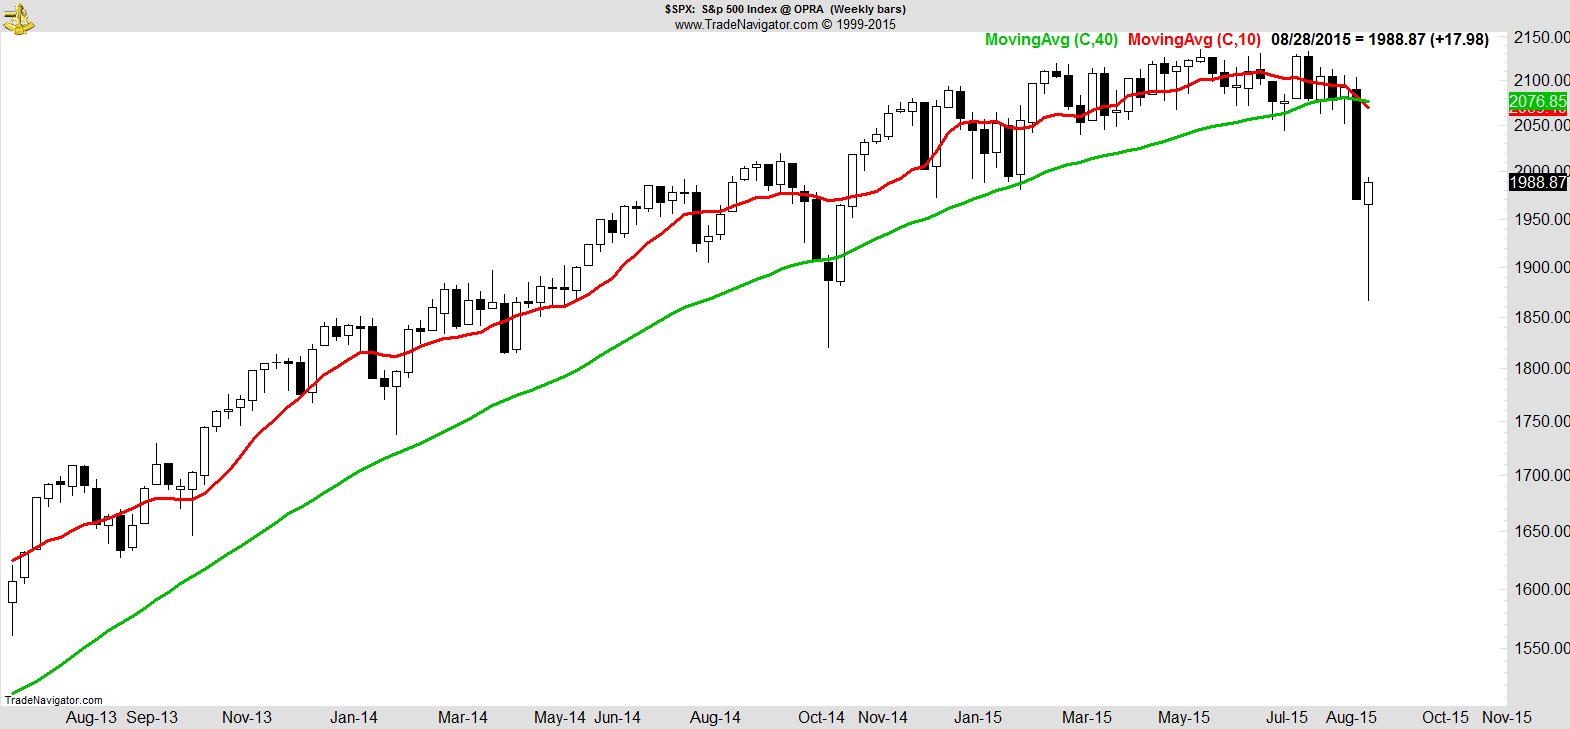
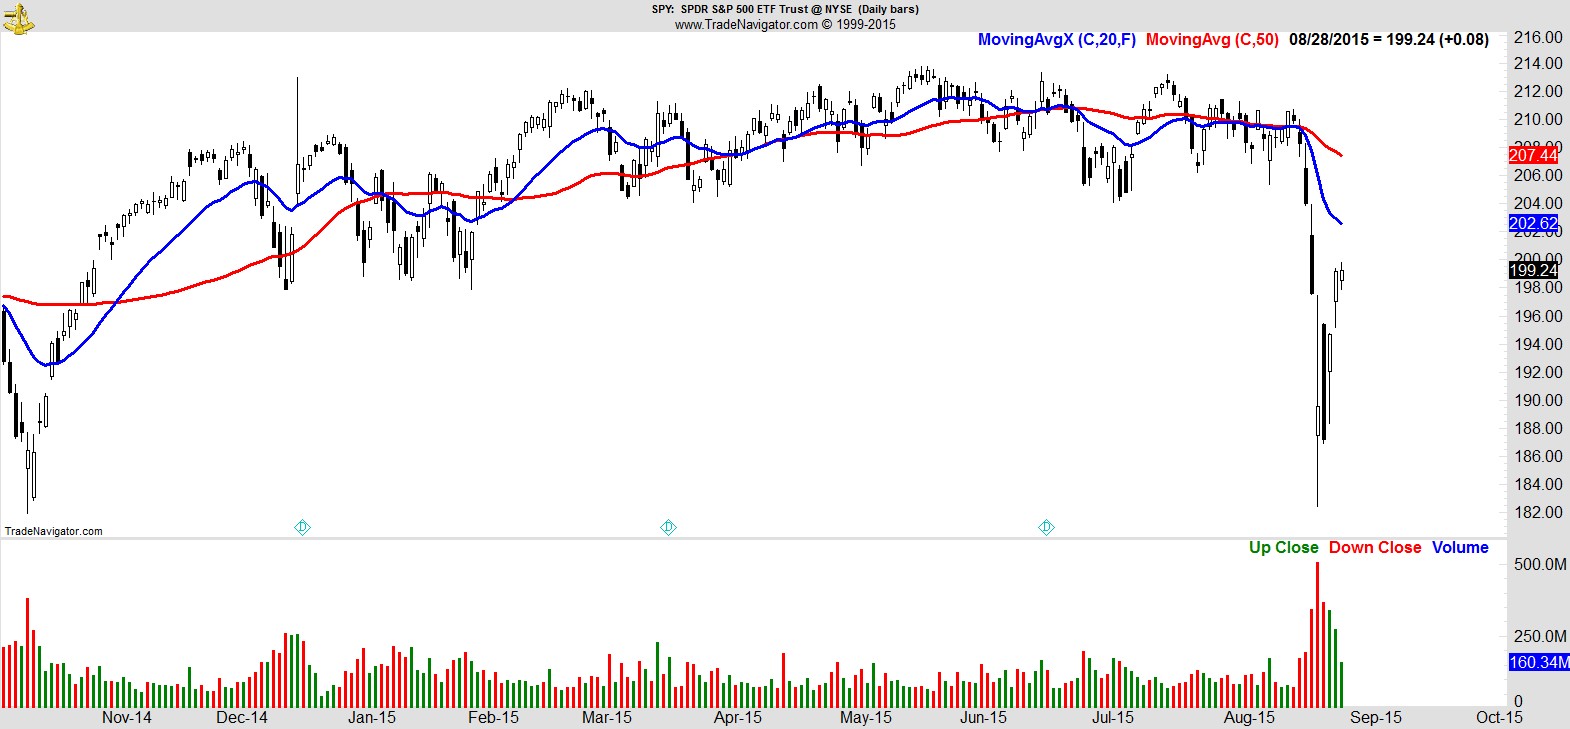
It can be tempting to look at that long reversal candle on the weekly and see it as having bullish implications, but for me, longer-term that is still a chart that needs a lot of work to look attractive again. The 10-week MA has now crossed below the 40-week, and both are rolling over. The daily chart shows the waterfall decline and round trip we took this week in greater detail.
I also think it's interesting that as the week ended, the takeaway seemed to be that after everything that happened, we managed to finish higher. I even said it myself at the beginning of this post. It's because the memory of Monday's open is fresh in the memory, so the subsequent rally is somehow seen as resetting that move, returning to where we were, undoing the damage.
But we haven't undone any of the damage from the previous week, something I believe more likely points to lower for longer, rather than a reversal. Let me show that same weekly as a line chart and you'll see what I mean.
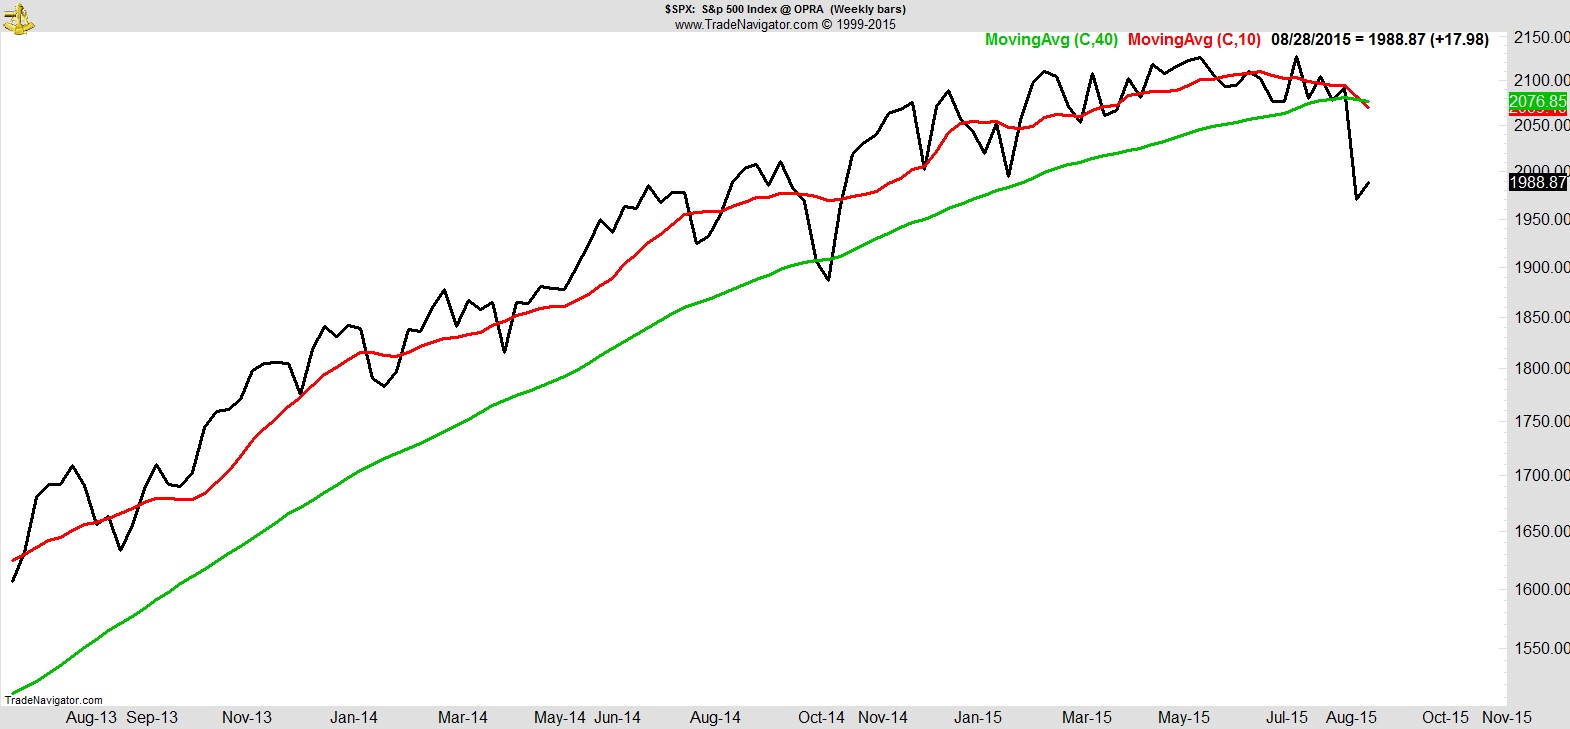
Suddenly looks like a pretty pathetic bounce doesn't it? Last week we had a massive selloff. This week we barely closed higher.
I realize it's the vagaries of the calendar that create that effect, but I think the true takeaway is for all the drama that's unfolded this week, no progress was made in recovering that original break, and the longer that remains the case the harder it will be.
Obviously the S&P has some previous form in this regard, with its dramatic 'V' shaped reversals, the last of which was from the very area where this week's resurgence began, so we know not to underestimate the power of this bull market longer-term, but it would surely be something truly remarkable if we were able to continue to rally at this pace to fresh highs from here.
As we'll see from the sector charts later, the damage that's been done has been far greater than anything else we've seen previously, where one rotation after another somehow kept the indices moving higher, and leading stocks were still easily identifiable.
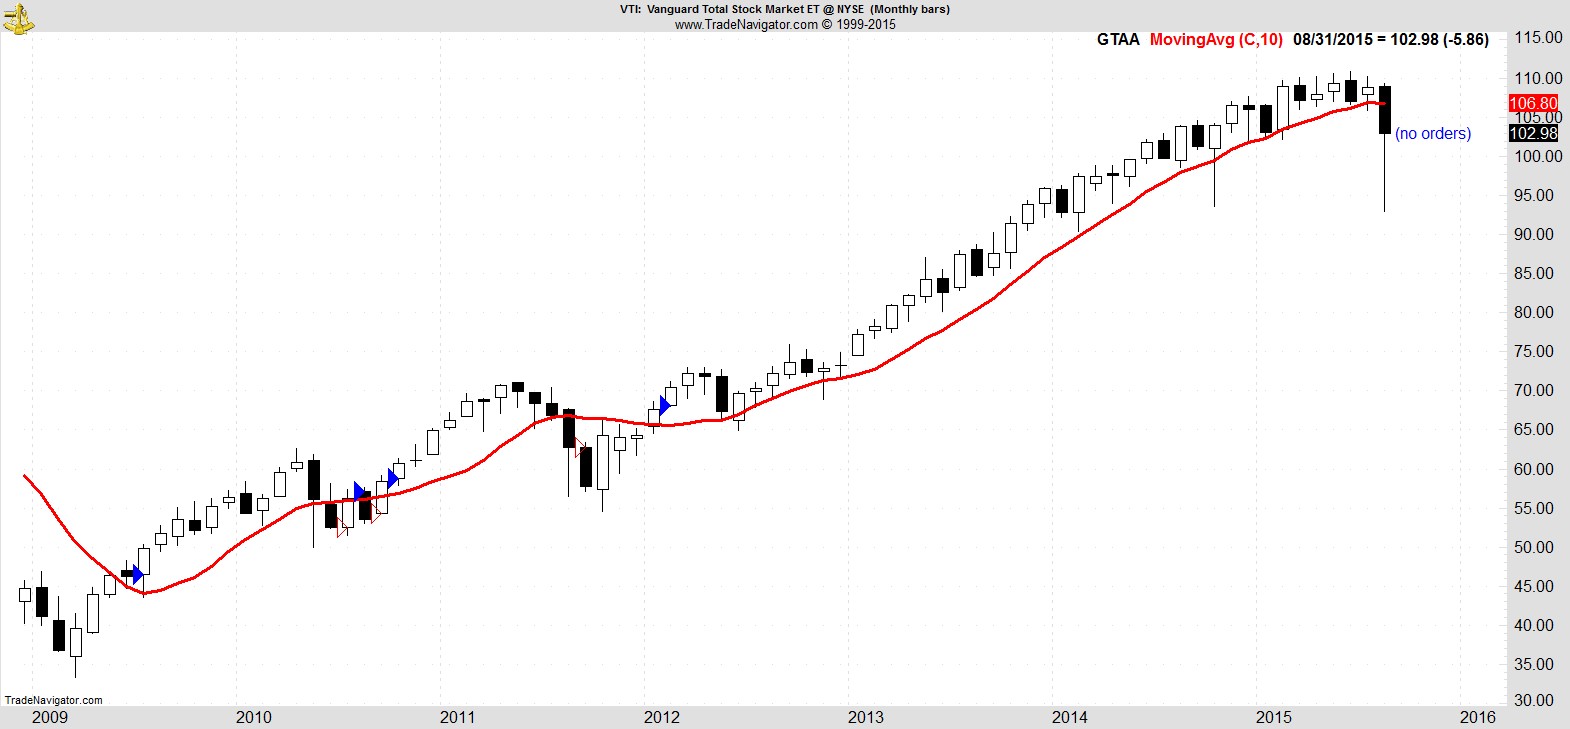
As if to emphasize the magnitude of this move and the impact it's having across multiple timeframes, we're also on the verge of a sell signal from the GTAA portfolio model depicted in Meb Faber's 'The Ivy Portfolio'.
For those unfamiliar with it, it's a price-based model which in its most basic form can be replicated with 5 ETF proxies, for a equal-weighted portfolio of US Stocks ($VTI), Foreign Stocks ($VEU), US Bonds ($IEF), Real Estate ($VNQ), and Commodities ($DBC).
It allocates 20% capital to each component above its 10-month moving average. You sell when they close below it and move to cash.
By my calculations (there are various versions) it's been out of commodities for over a year, and in the last few months has seen exits in all the other components except US Stocks, but this current decline is about to end that run. If you're not able to see it from the chart below, the buy signal for US Stocks ($VTI) was over three and a half years ago in February 2012, and unless it rallies over 4% on Monday, it will finish the month below its 10-month MA, triggering an exit signal and leaving the model entirely in cash.
.
Alpha Capture Portfolio
This week our portfolio declined 4.6% vs +0.9% for the S&P.
It's now +0.5% YTD vs -3.4% for the S&P.
Even though we continue to outperform the market by 4%, having previously been ahead by as much as 10%, it's still disappointing to see the pullback of the last two weeks, especially when we've remained so disciplined, taking exits and protecting capital.
What has made this correction so devastating is its speed.
A 12% move over several weeks? No problem, we take our exits one by one and we're long gone before the worst happens.
12% over a few days? That's a different story. When it happens all at once, even if you're disciplined in following your rules and taking your exits, it's like you don't see the benefit of it. At least not immediately. When you get an exit signal and it gaps even further against you when it comes to executing it, it's as if you didn't obey your stop at all.
It's kind of ironic that had we have been in weaker stocks, we would have had exit signals earlier the previous week with nothing to replace them, but as so many of them had held up so well, the previous week's selloff merely brought them a little closer to their stop without invalidating their trends, before they then gapped significantly lower to leave us with a handful of exits for Monday.
Those were tough signals to execute into Monday's open, having to watch them rally back strongly afterwards, and we then had a further two exits for Tuesday, where this time we had a nice gap higher to sell into.
That took us to around 90% in cash, where we still are now, with just a couple of names and ready for whatever comes next.
We were perhaps fortunate we didn't have to contend with the horror story scenarios we've heard this week, of the crazy prices that got traded on some ETFs and are still there for all to see, making some charts anomalous.
On the other hand, it was perhaps a testament to how we position size, that we didn't lose more, again underlining the fact that as disappointing as a loss may be, it was completely tolerable, and it is absolutely recoverable.
Ultimately it's about staying in the game, and weeks like this are a test of every aspect of your methodology and you as a trader.
It doesn't matter what your backtest showed, or how you did in your paper trading account, there is absolutely no substitute for trading real-time through volatility events like this week. Regardless of whether you made or lost money this week, if you followed your rules and you're still here to tell the tale, then give yourself a pat on the back. Every trade was a good trade.
.
.
Sector Overview
I had lamented the previous week's action as being 'downright ugly', 'making any attempt to rank the sectors fairly meaningless', but clearly I was a little premature with my invective, and had no idea what I would be looking at this week. This is going to be messy but let's try to make sense of it all.
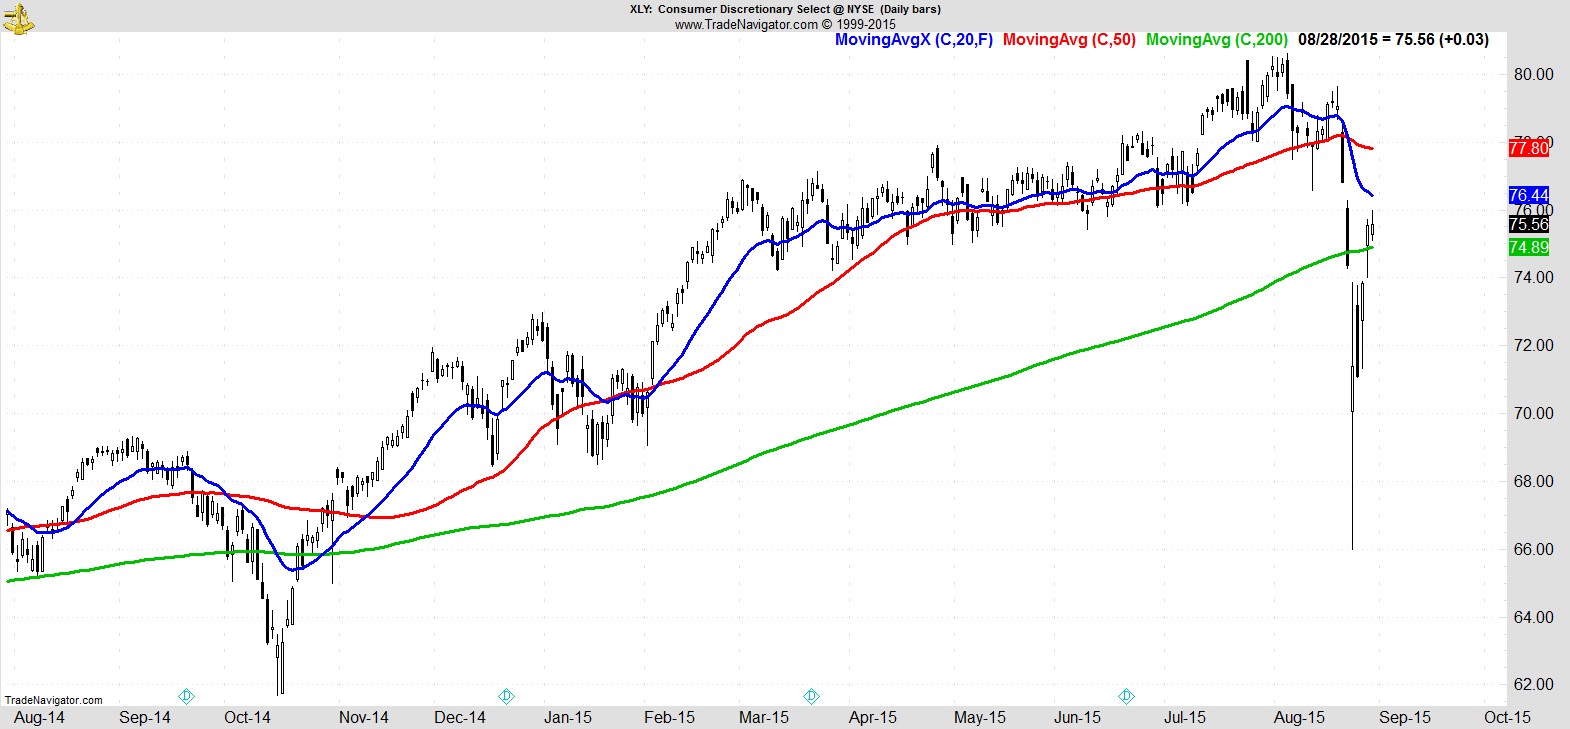
We do at least have a clear leader at the top, and that has to be Consumer Discretionary ($XLY), seeing as it's the only Sector SPDR above its 200-day MA, one that's even still rising for the moment.
.
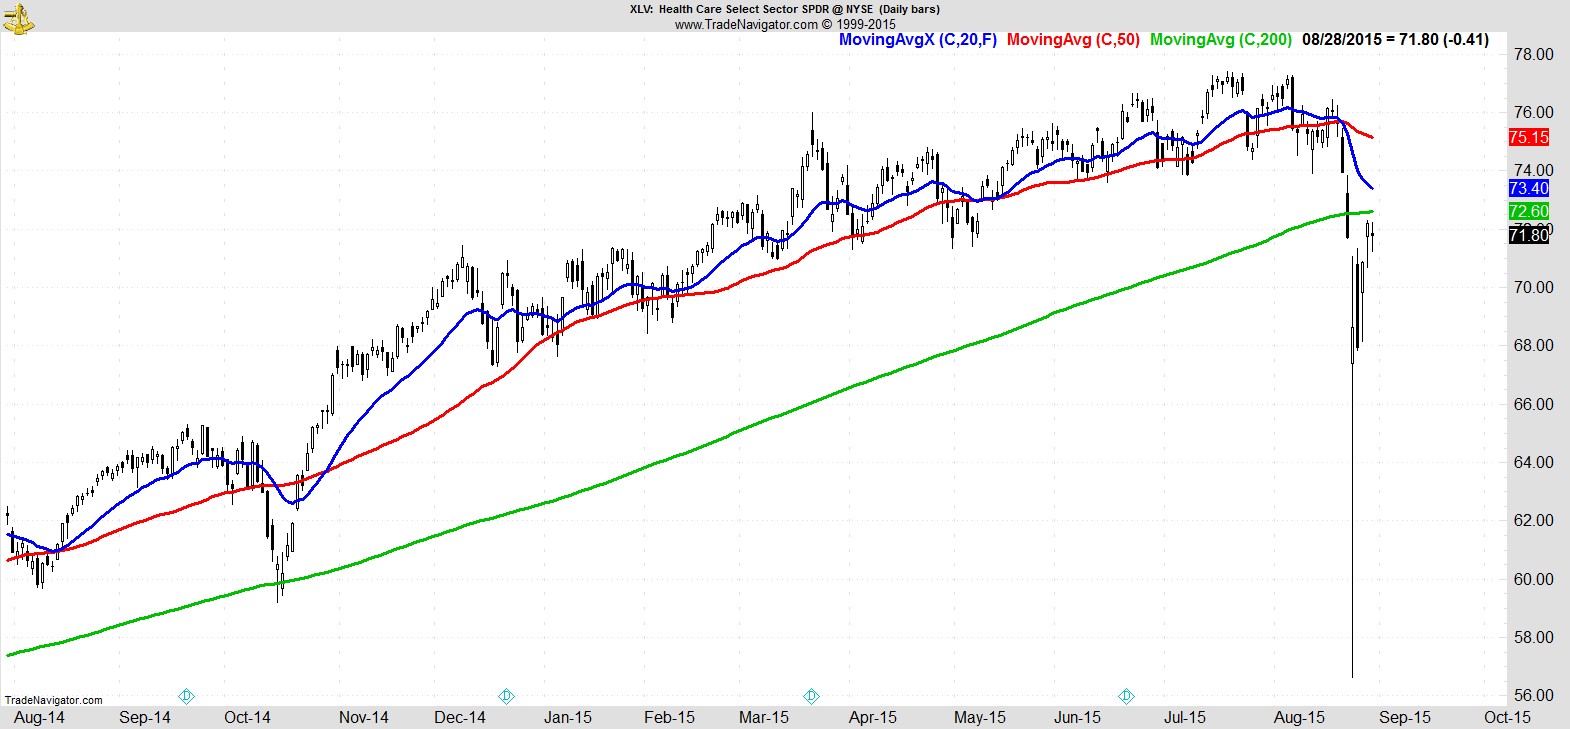
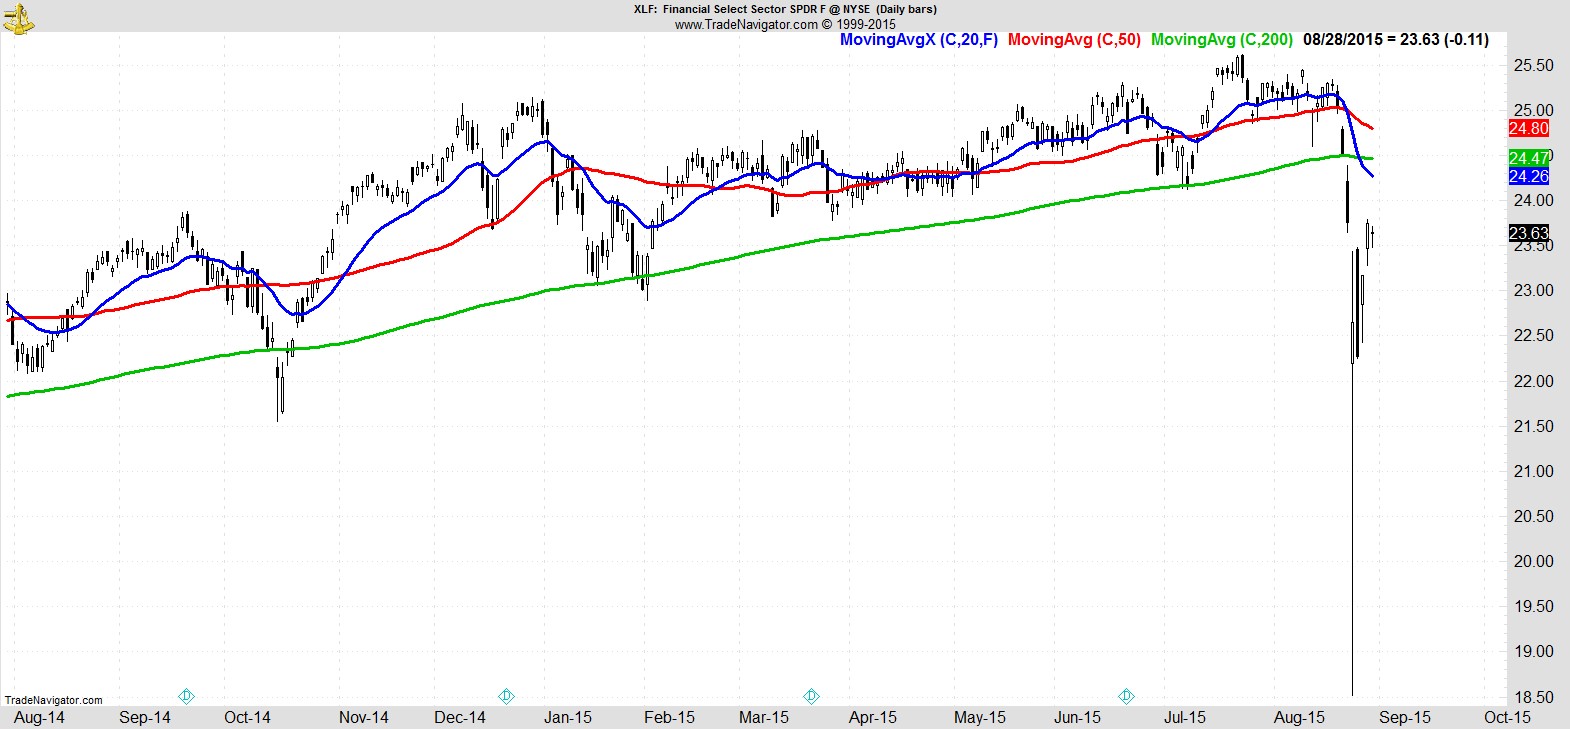
Then it gets very subjective very quickly. I'm going to put Healthcare ($XLV), and Financials ($XLF) next, the two closest to testing the underside of their 200-day.
.
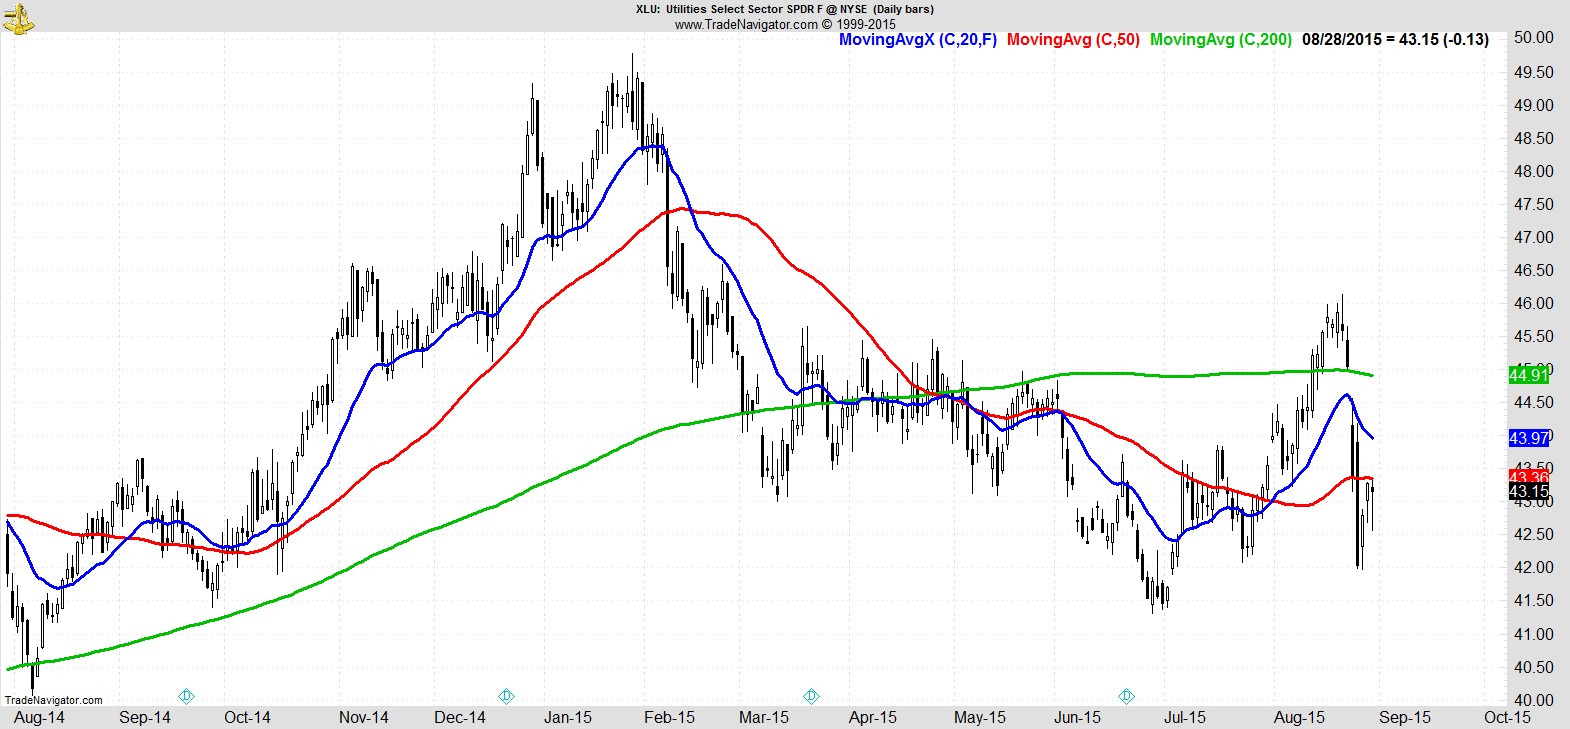
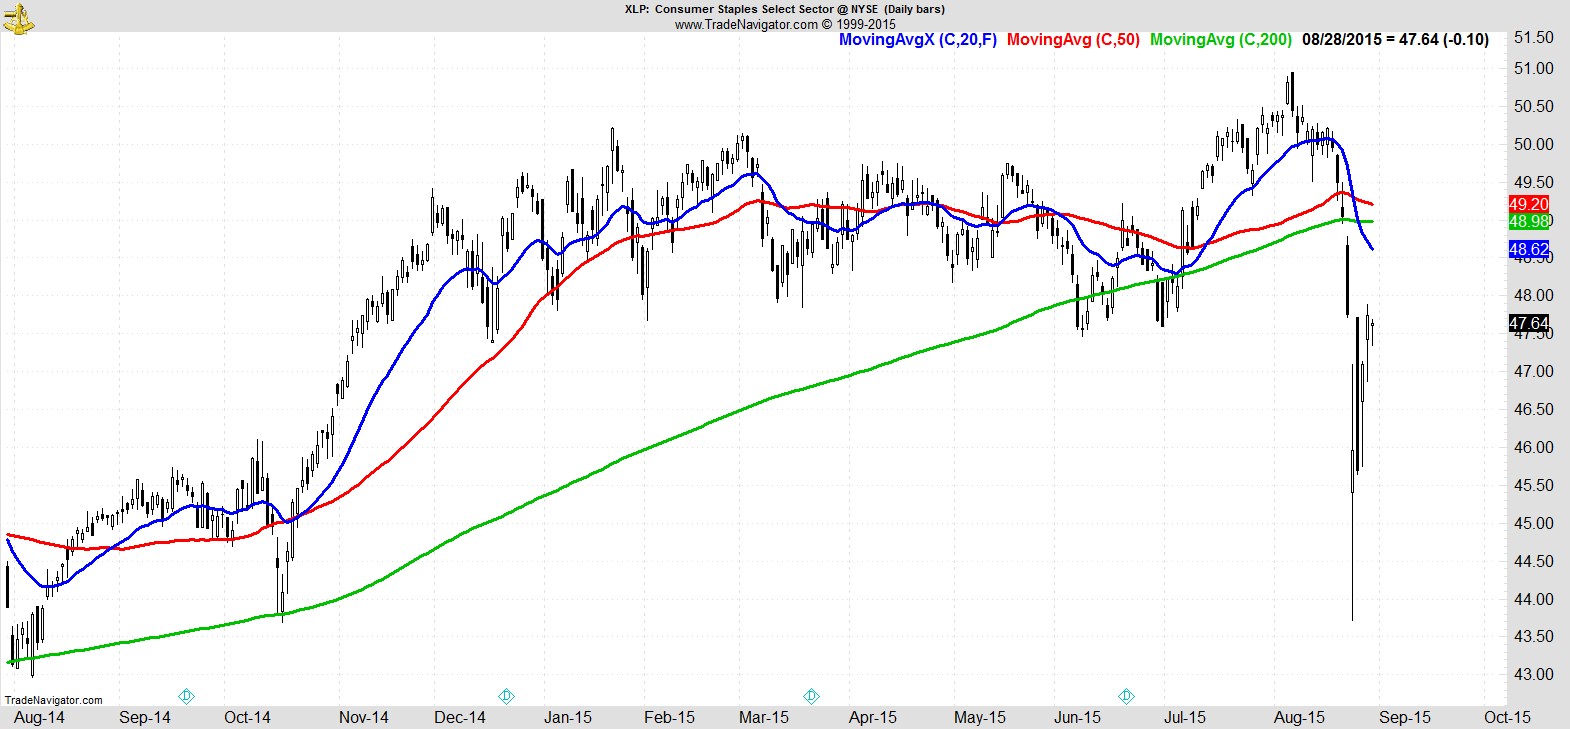
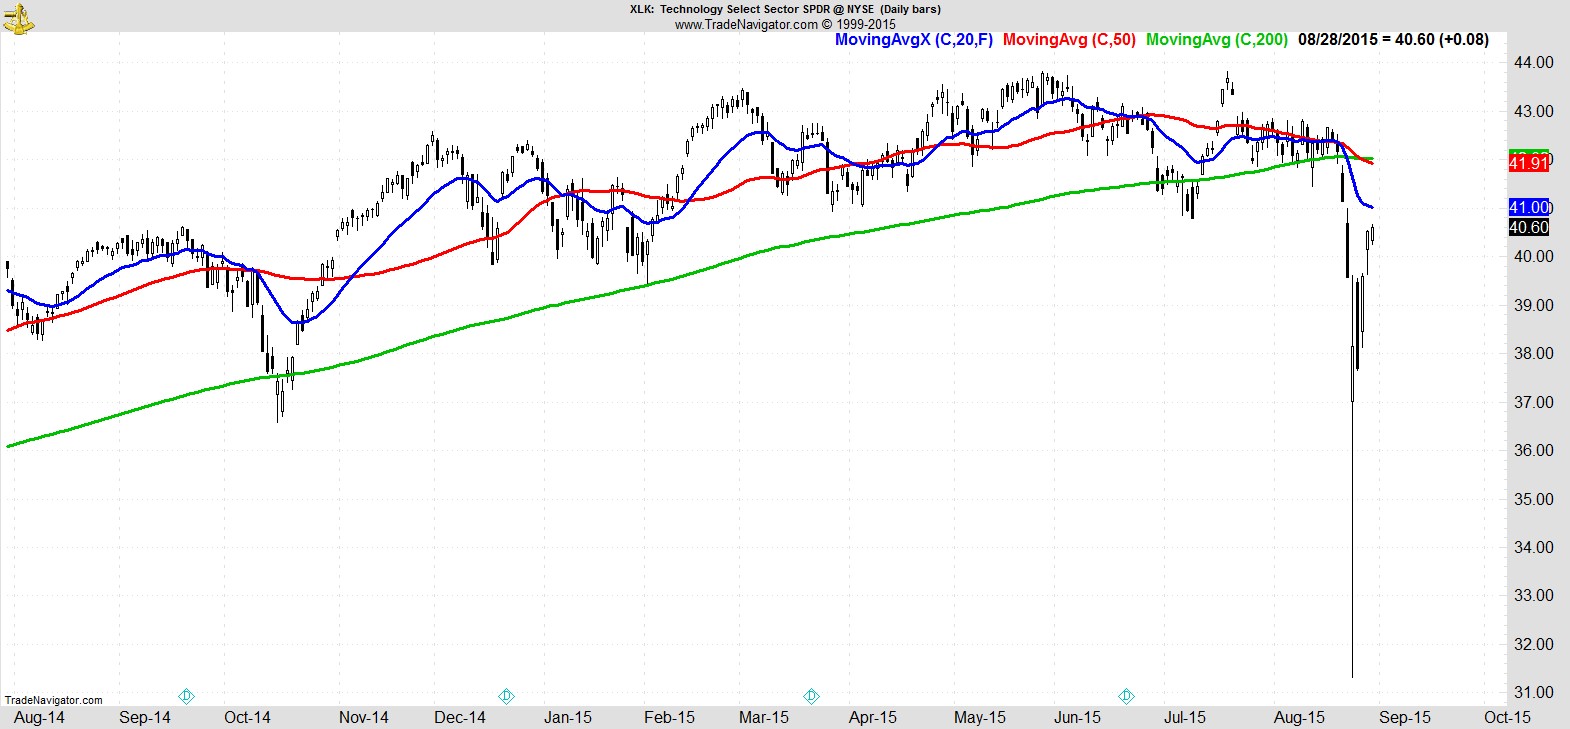
They're followed by Utilities ($XLU), Consumer Staples ($XLP), and Technology ($XLK), which suffered more protracted declines.
.
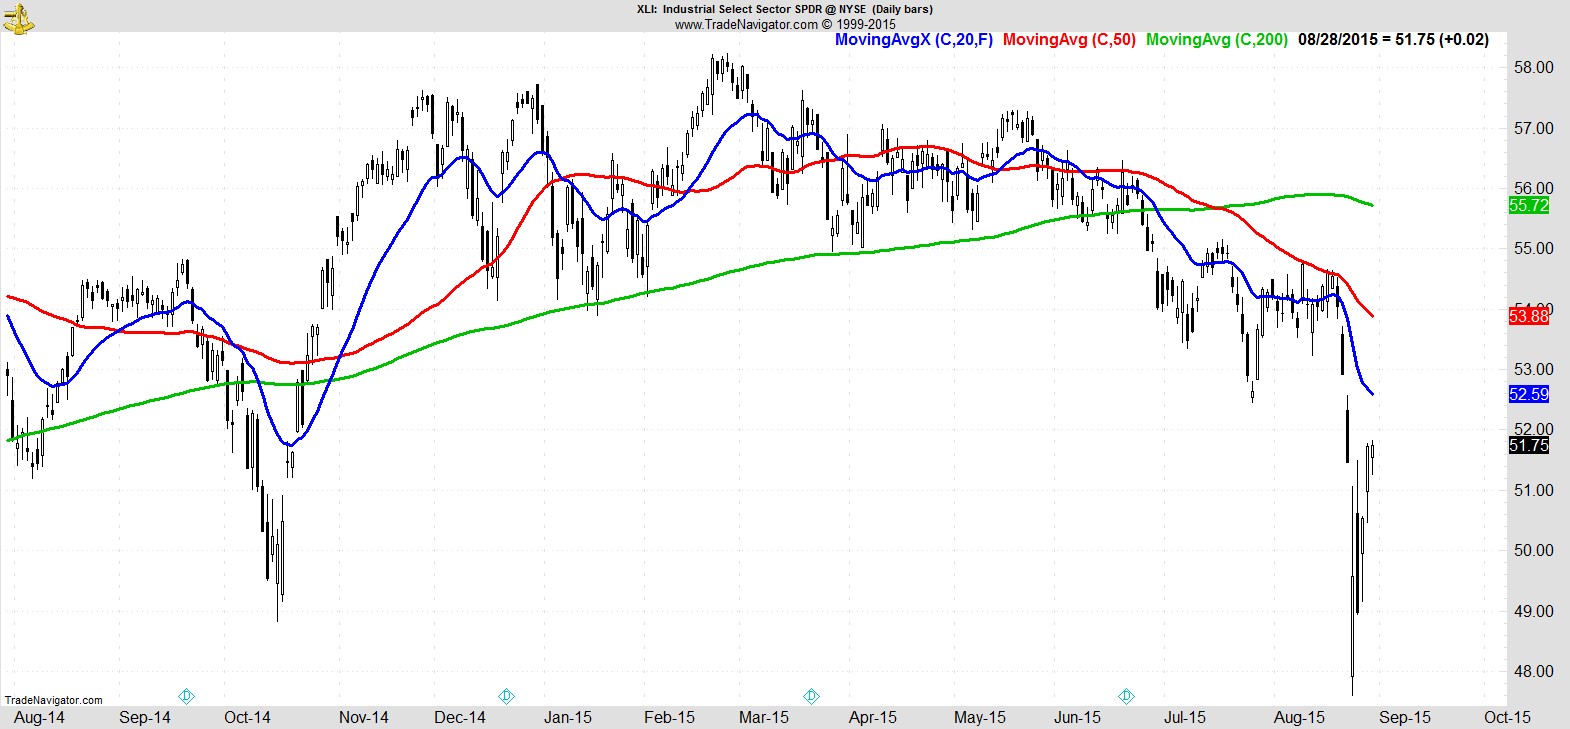
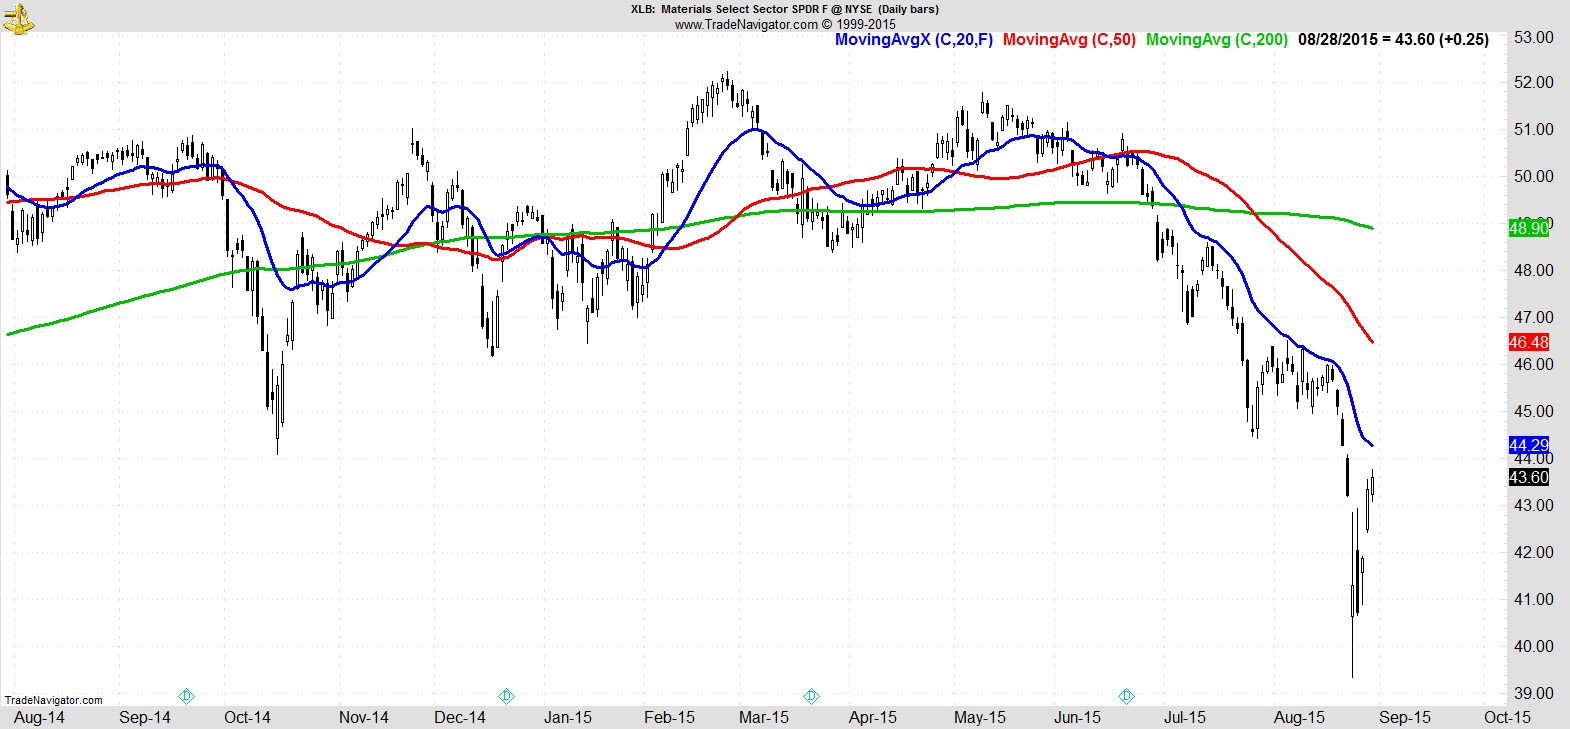
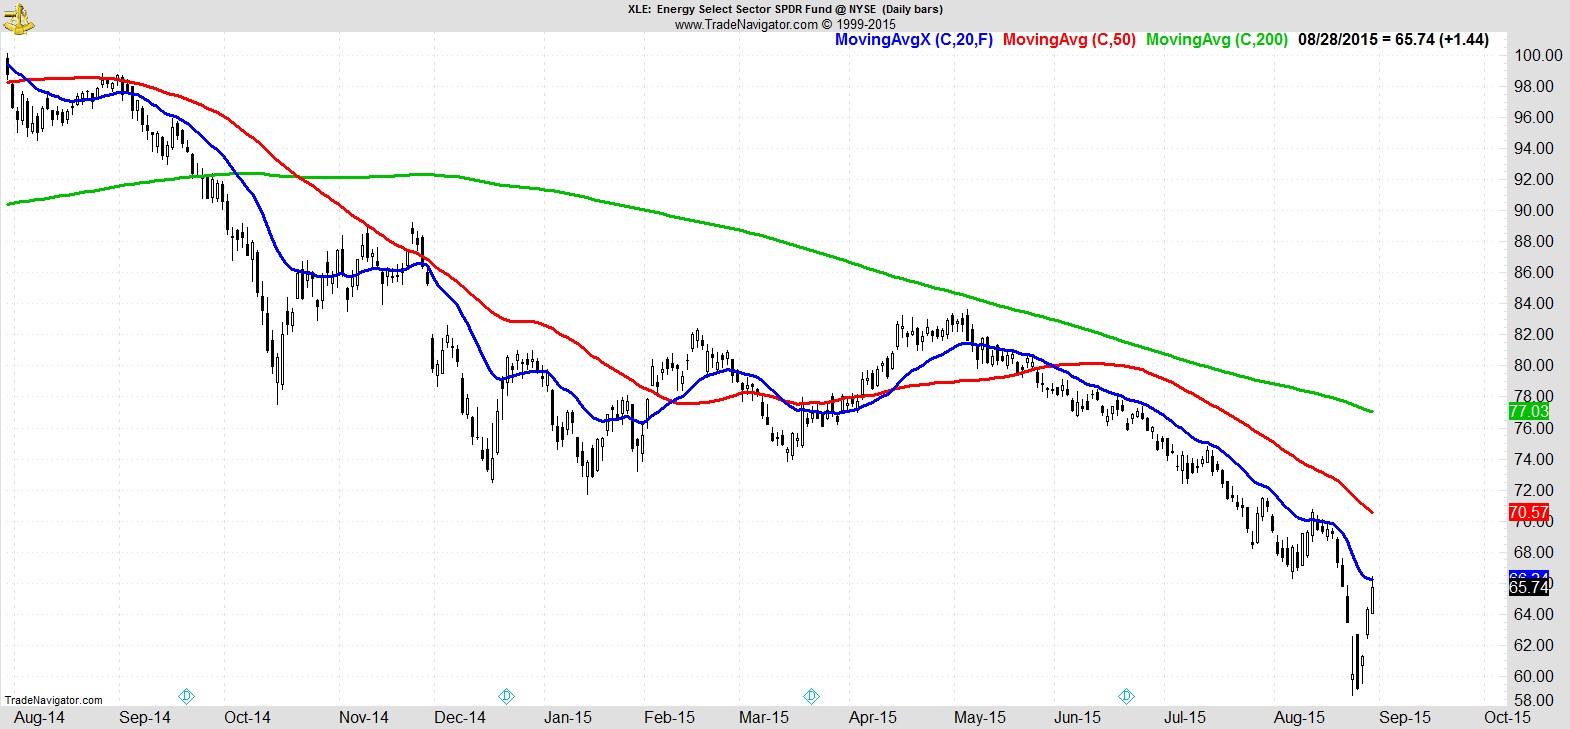
Last, but not least, as they were all up on the week, we have Industrials ($XLI), Materials ($XLB), and Energy ($XLE).
.
Watchlist
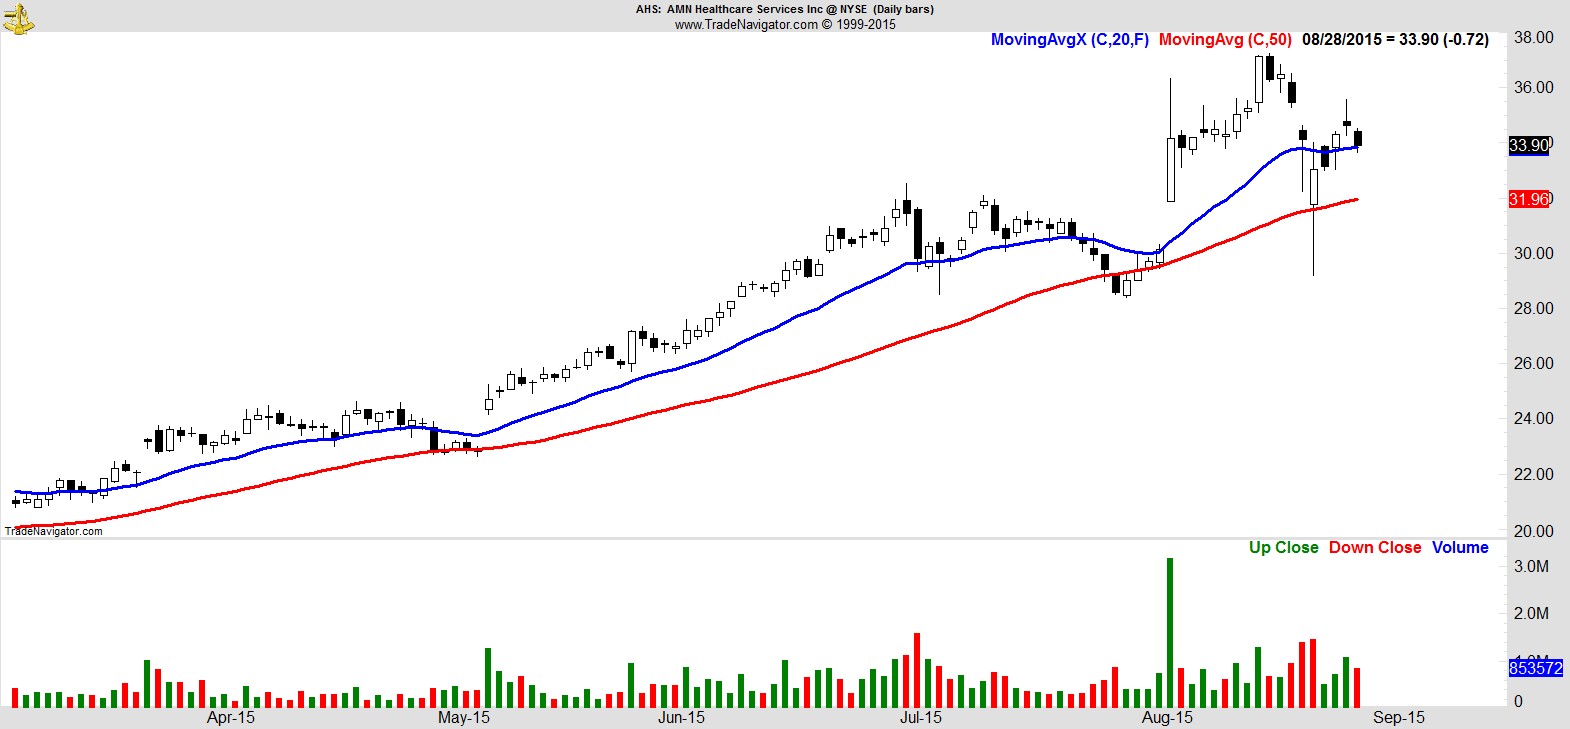
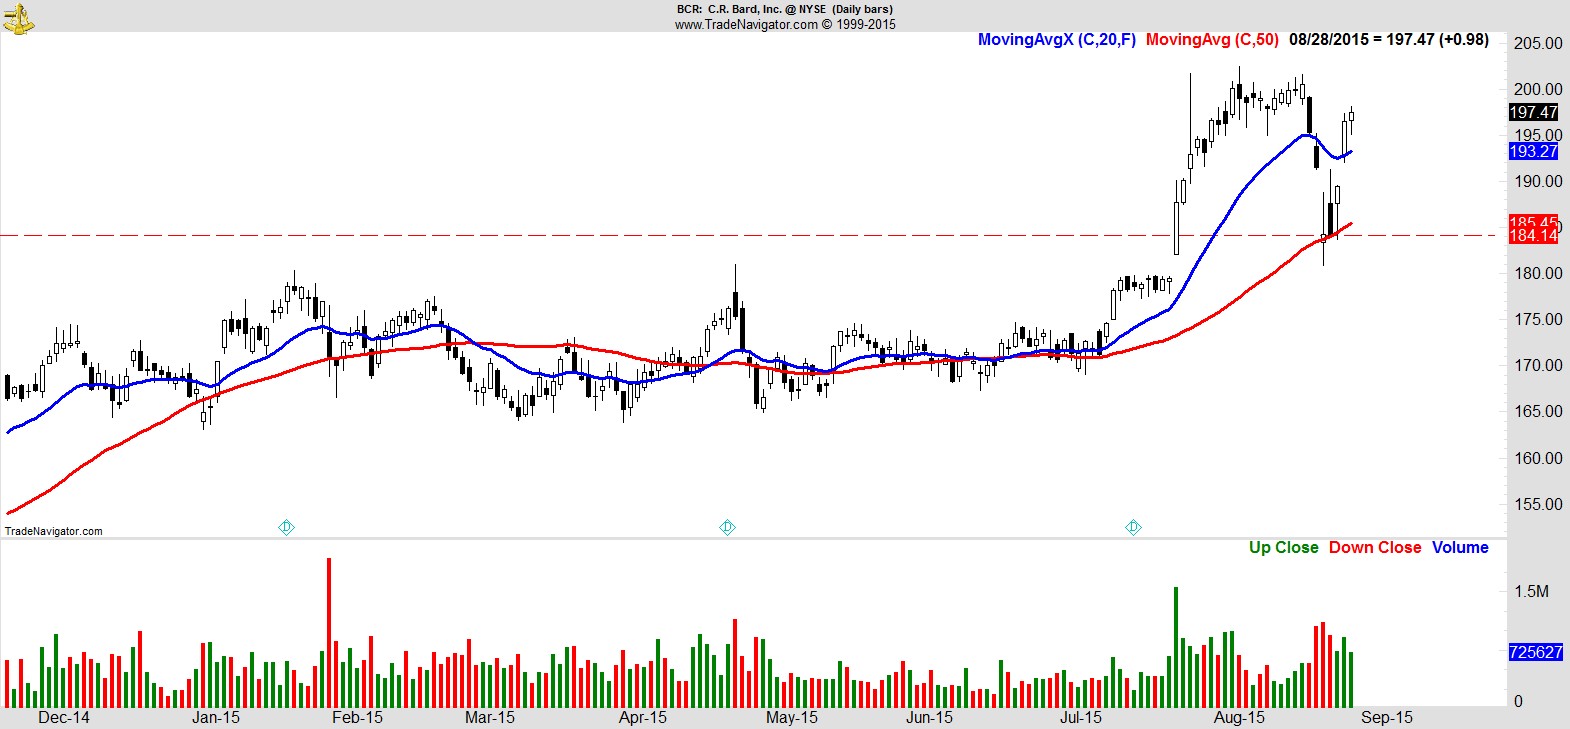
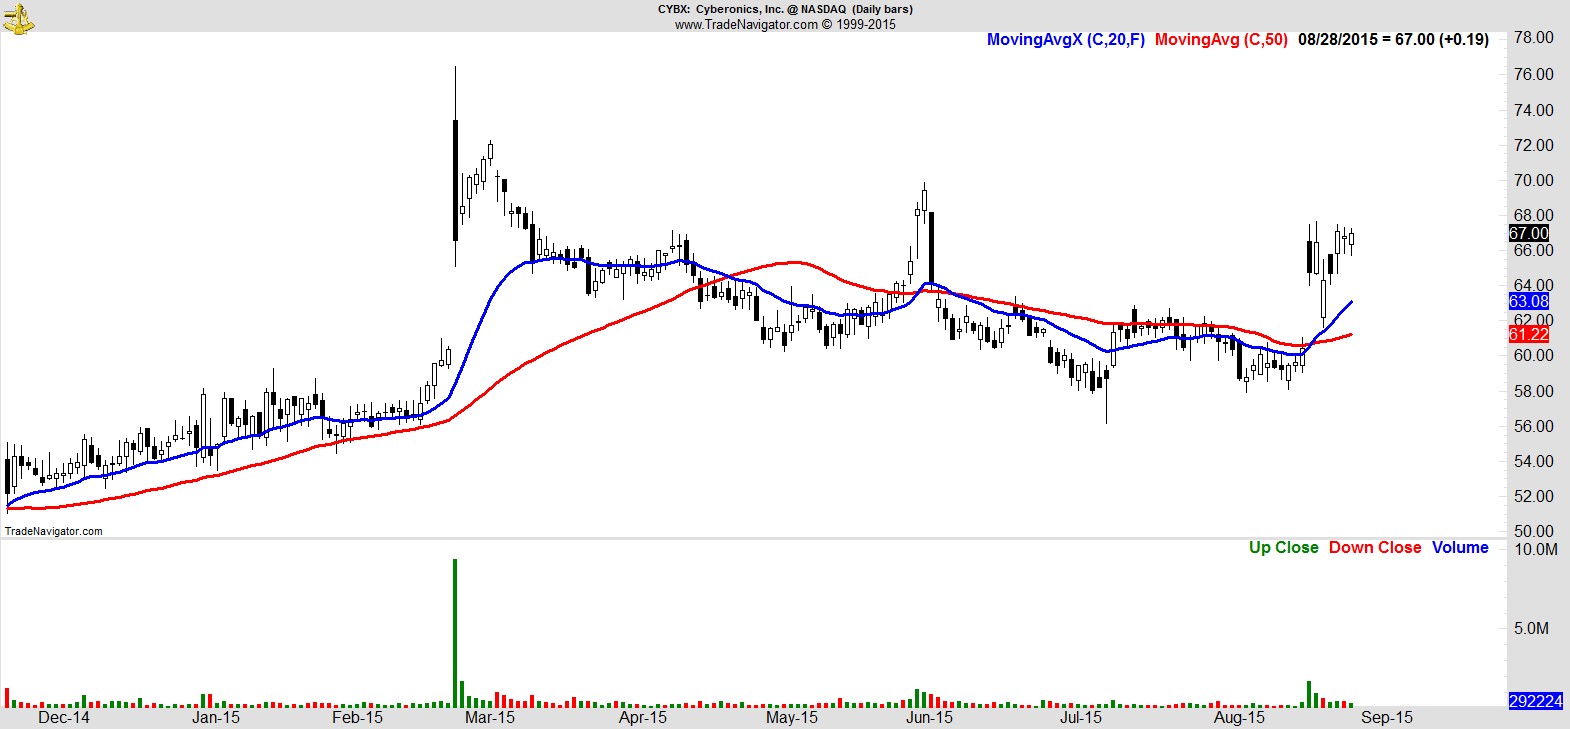
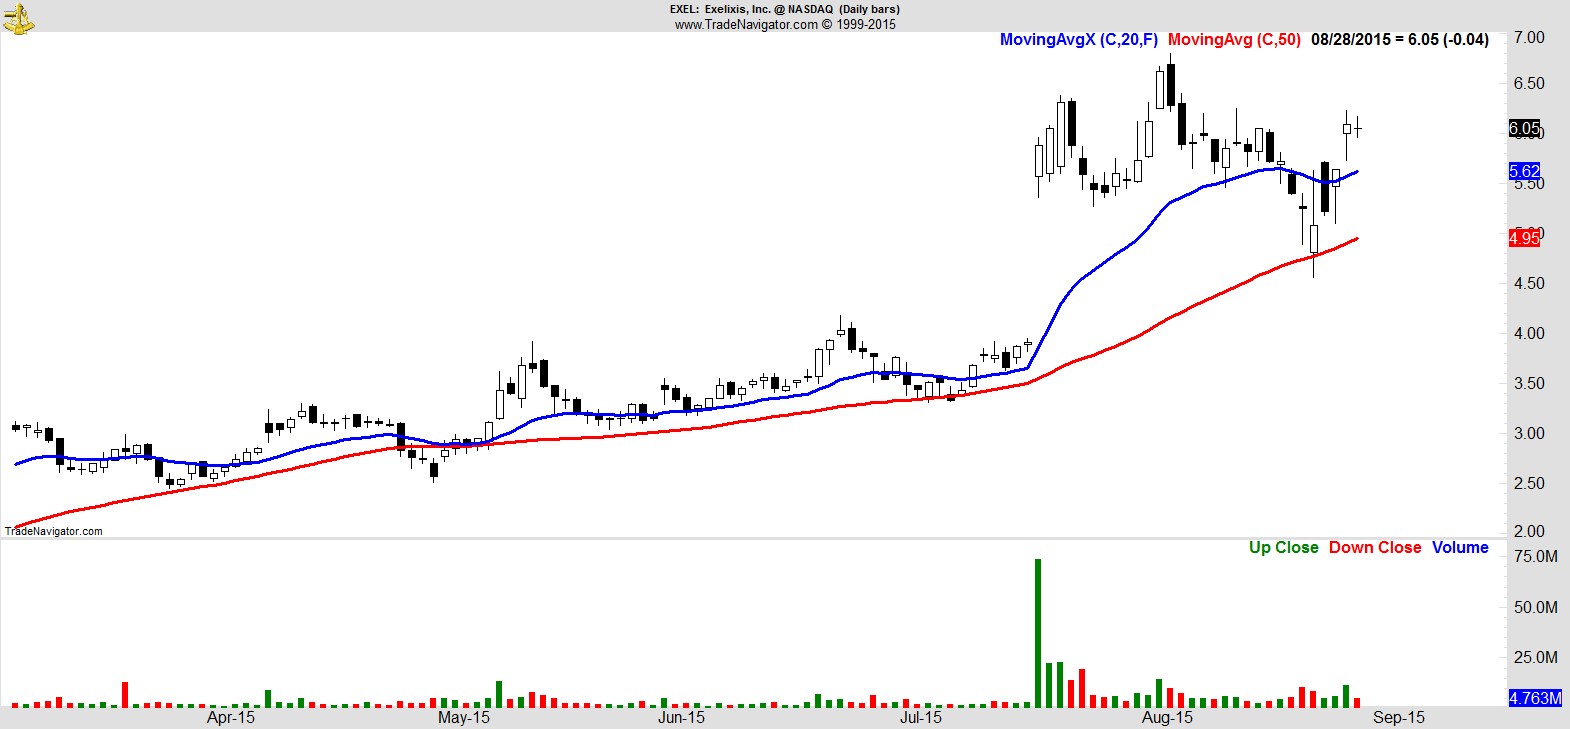
Surprisingly, our watchlist is back up to a very reasonable 25 names. I've had to dig a little deeper, which typically means smaller cap, but it's also fairly narrow, in that other than a couple of energy names, there are a lot of healthcare/biotech names, and a healthy dose of consumer discretionary too, but not much else.
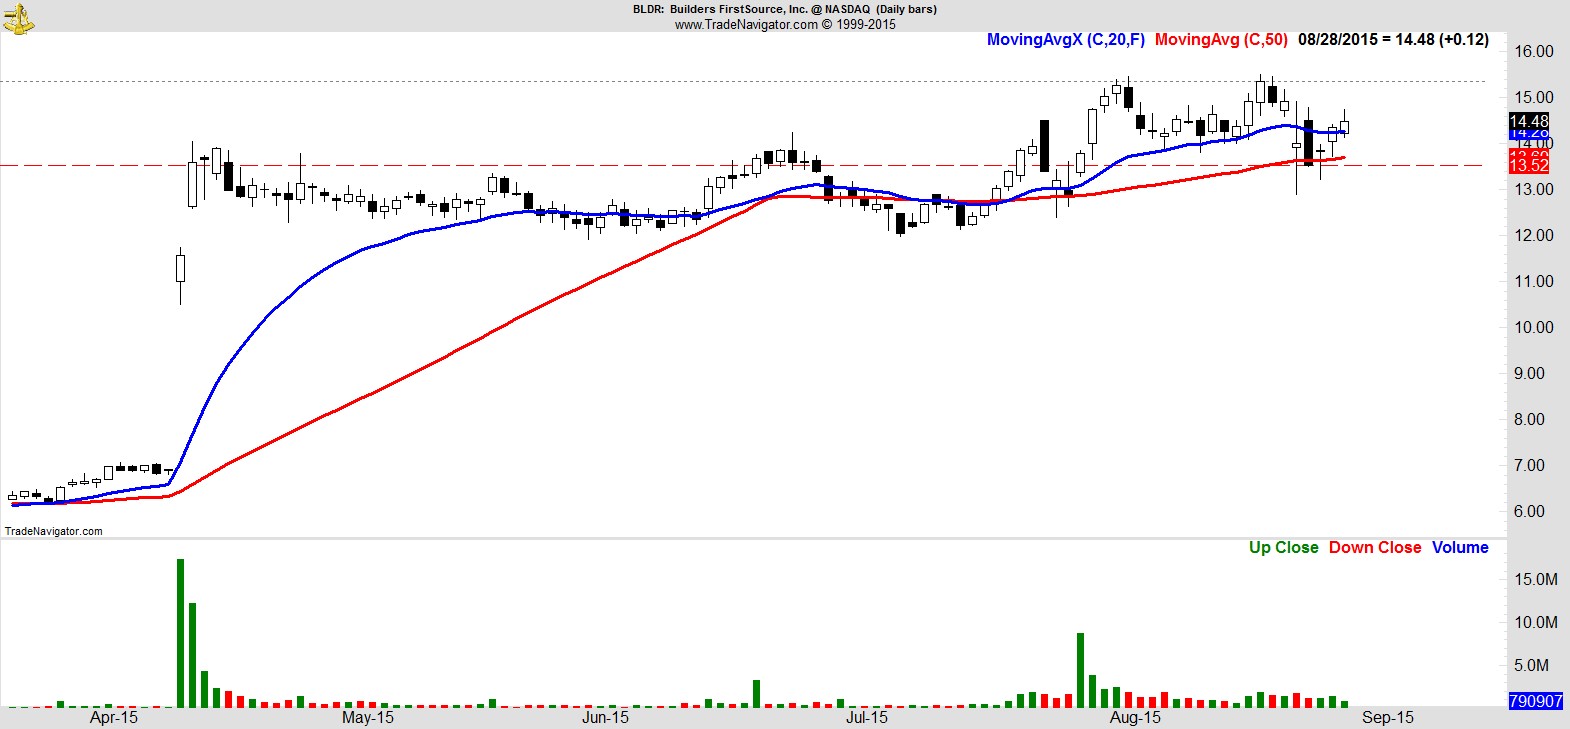
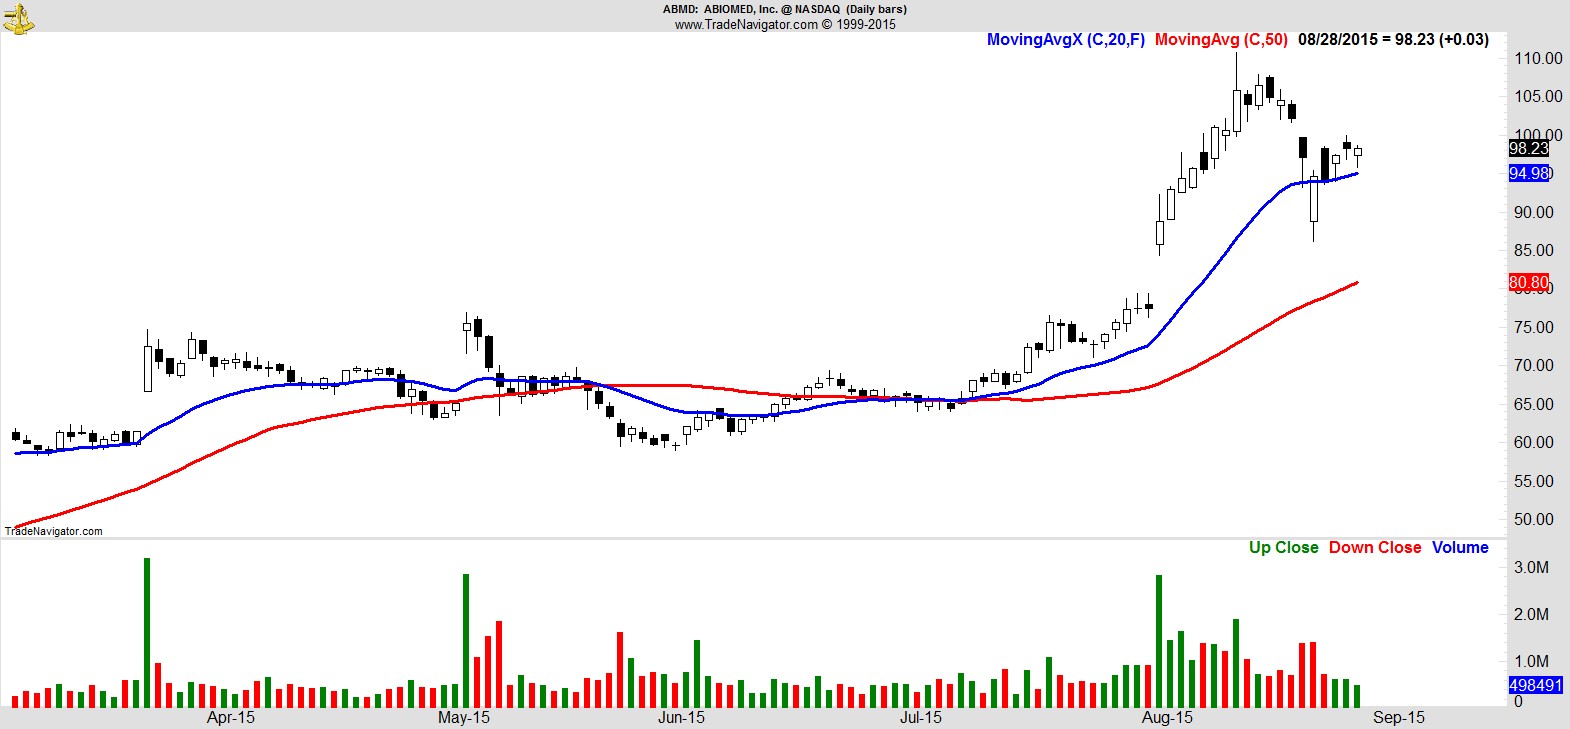
Here are 10 of the 25:-
$BLDR
.
$ABMD
.
$AHS
.
$BCR
.
$CYBX
.
$EXEL
.
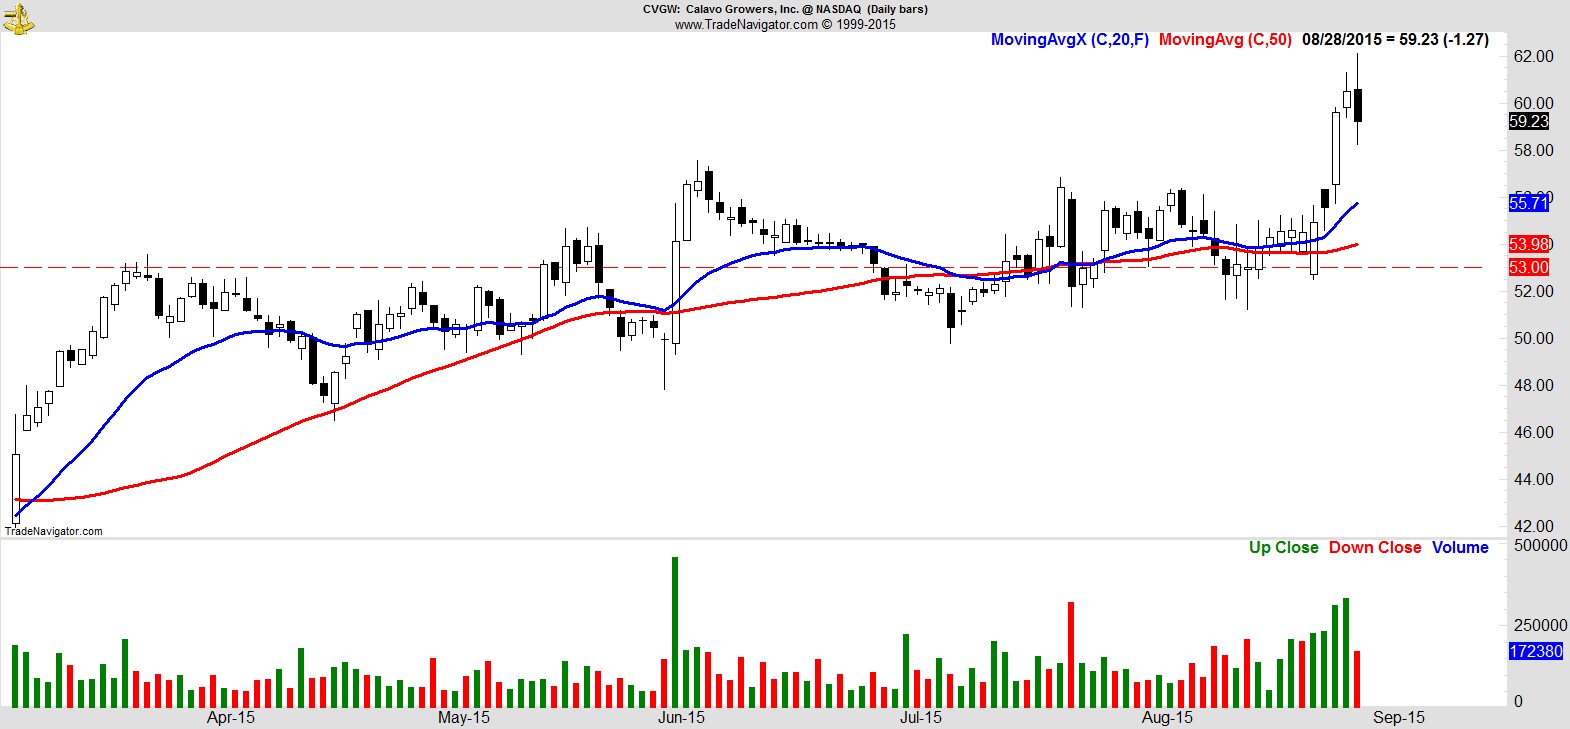
$CVGW
.
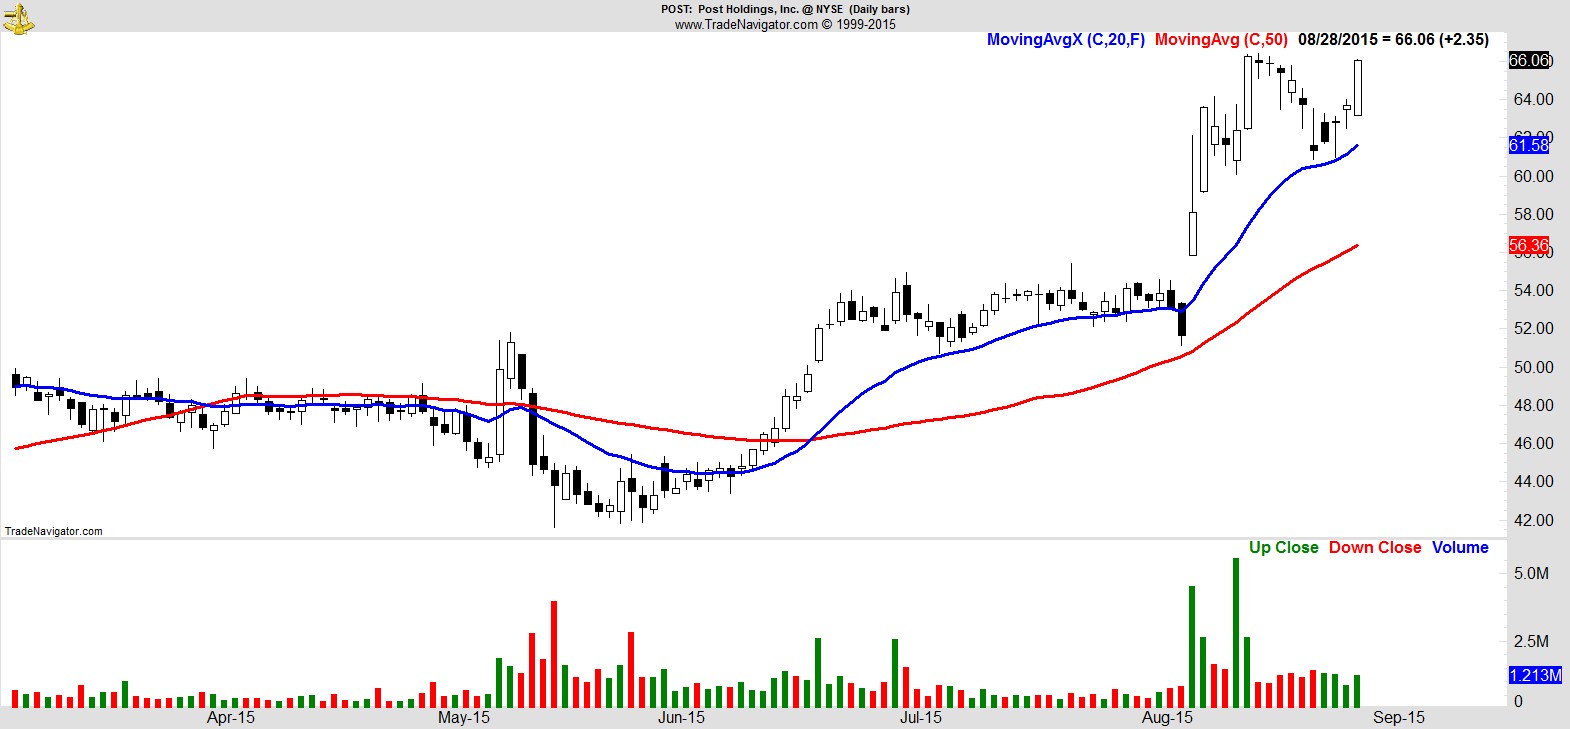
$POST
.
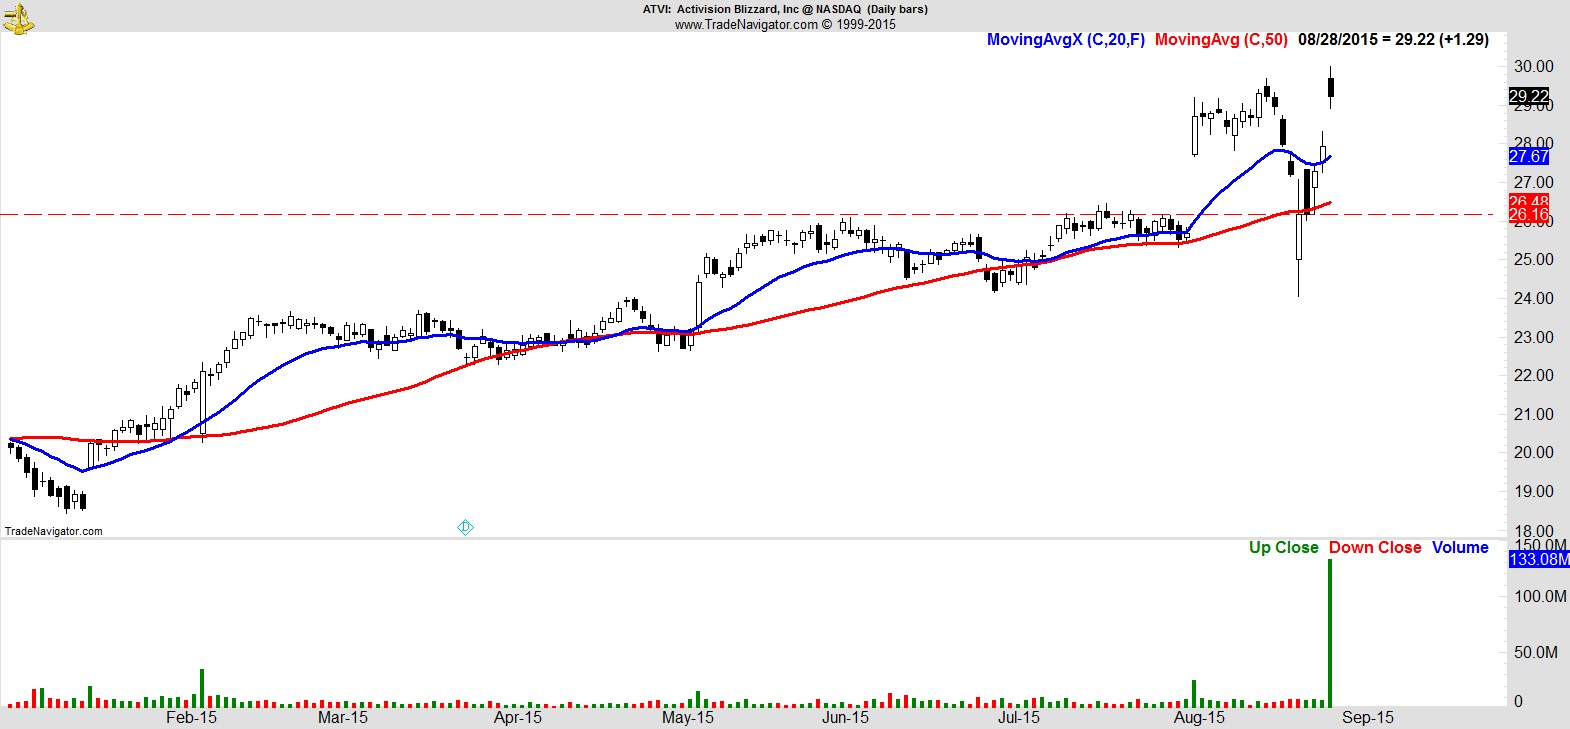
$ATVI
.
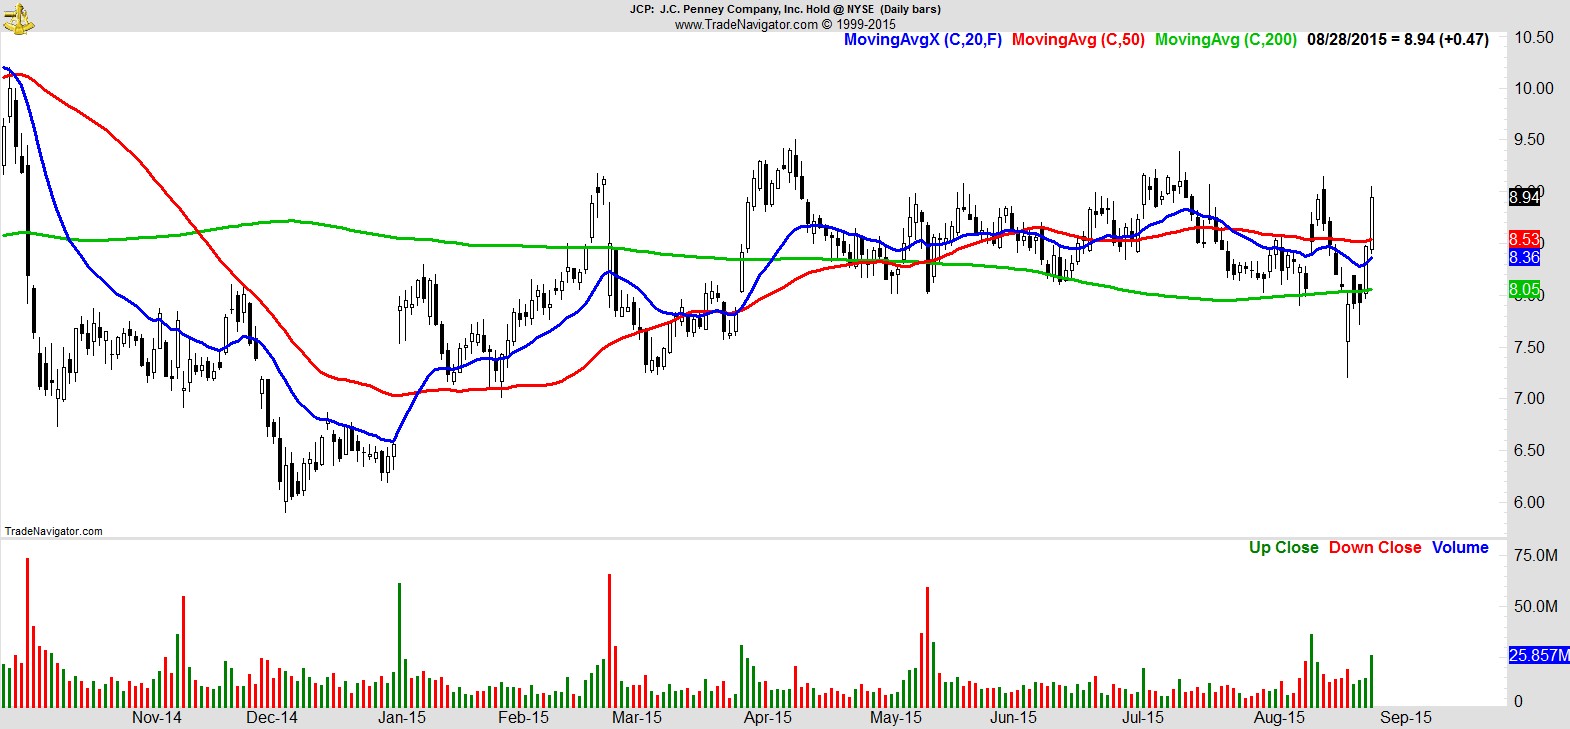
$JCP
.
Recent free content from Jon Boorman
-
 Weekend Review and Watchlist
— 9/30/17
Weekend Review and Watchlist
— 9/30/17
-
Weekend Review and Watchlist
— 9/22/17
-
Weekend Review and Watchlist
— 9/17/17
-
Weekend Review and Watchlist
— 9/10/17
-
Weekend Review and Watchlist
— 9/02/17