

The Bulls Are Arguing That It's Over...
Modern times demand modern thinking in portfolio design. Learn more...
While it took a while for things to sink in, traders did finally decide to celebrate the fact that Super Mario brought the bazooka to this week's ECB meeting. But it did take about a day to weigh the positives and negatives that Mr. Draghi offered up last week.
First there was the positive. Even with expectations running high for Draghi's gang to "do more" to help stimulate the Eurozone economy (oops, err, I mean, boost inflation), the ECB didn't disappoint. However, the pronouncement by Draghi that there wasn't going to be any more rate hikes coming served as wet blanket on the day.
But by the time Friday rolled around folks apparently realized that with more QE coming and oil rallying, it was time to focus on the positives. And by the time the closing bell rang, the U.S. stock market indices had resumed their recent rally, broken through some important resistance, and the blue chips had even moved back above their much ballyhooed 200-day moving averages.
As such, the bulls can now be heard telling anyone who will listen that the bear market has ended and happy days are here again.
So, in an effort to stay on top of what Ms. Market IS actually doing (as opposed to what I think she MIGHT be doing), I wanted to start the week by taking a look at some charts and reviewing our important indicators. The goal is to see if anything has really changed.
Let's start with the daily chart of the S&P 500...
S&P 500 - Daily 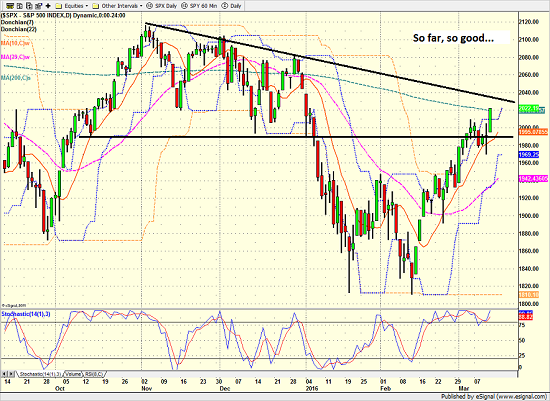
View Larger Image
As you can plainly see, the recent rally has been impressive with the S&P moving up 10.55% in just three weeks. Of course, the corresponding rally in oil prices has had a lot to do with this.
It is also positive that the S&P appears to have broken above important resistance. However, it is worth noting that the downtrend line that can be drawn from the November/December highs remains intact, which could serve as resistance at some point.
As I've mentioned a time or twenty over the years, it is important for the market to have some "oomph" behind it when moving off of important lows. So, let's take a look at the trend and momentum indicators in an effort to see if the current move is for real.
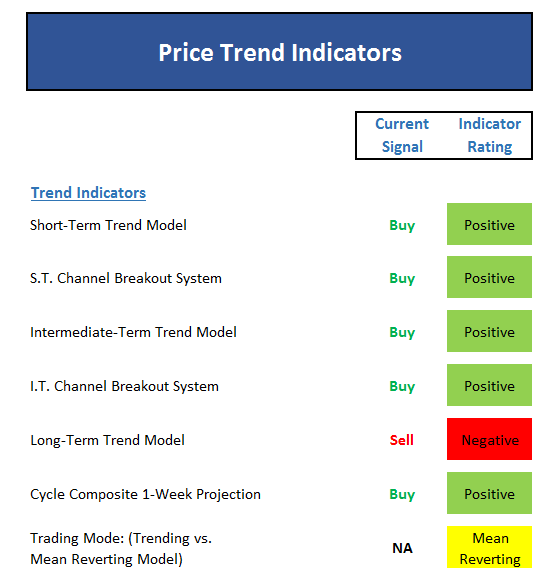
A quick glance at our favorite trend models suggests things are pretty positive here. The only negative is the fact that the S&P's 50-day moving average remains below the 200-day. However, given that the current move is only 15 days old, this isn't exactly surprising.
It is also curious that our indicators measuring the efficiency of the current trend are not positive at this time as all 3 of the models used here suggest the market is in a mean reverting mode. But while this remains something to keep an eye on, the situation can easily be rectified over time.
Moving on to the momentum indicators, we find a similar story being told on the board.
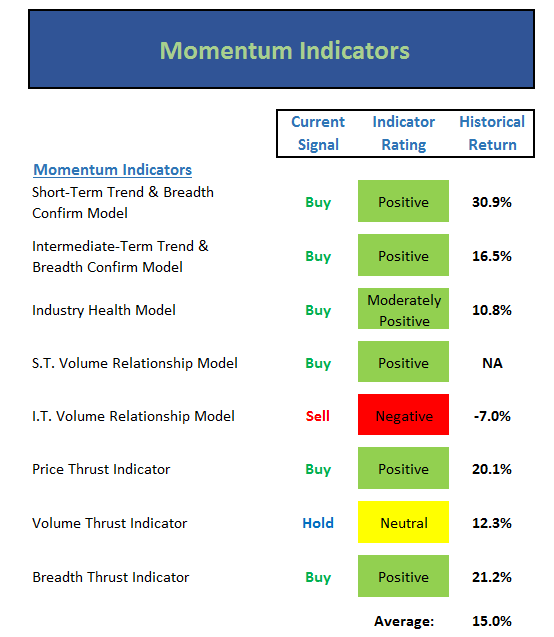
Again, the only negative is the long-term measure of the relationship between demand and supply volume. But given the depth and duration of the bear market, this again isn't surprising to see. It is also worth noting that while the reading remains negative, the indicator itself is improving steadily.
The only other indicator that isn't positive is the volume "thrust" indicator. What's important to understand here is that this indicator is coming off of a very positive signal, indicating that there was some serious "oomph" during the move off of the bottom. So, the neutral reading here isn't a negative, it's a symptom of the move's maturation process.
Now let's turn to the early warning indicators to see if we need to start preparing for a pullback in the near-term...
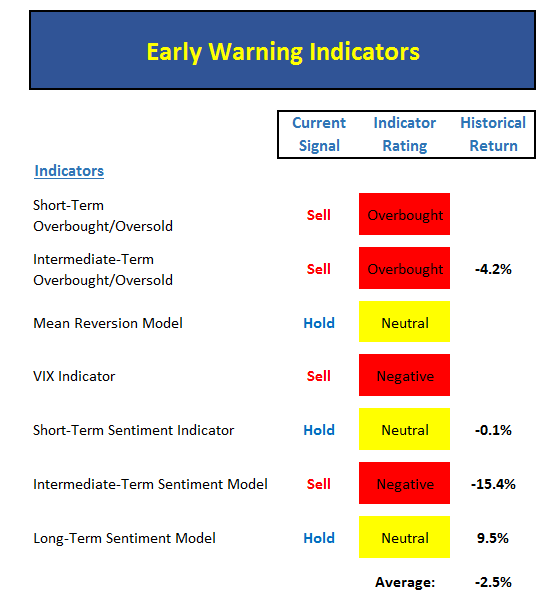
A quick glance at this set of indicators makes it VERY clear that stocks have run a long way in very short period of time and have become overbought in the process. And while there is no telling how far a move like we're seeing now can/will run, the early warning board tells us not to be surprised if the market pauses or pulls back in the coming days.
It is critical to understand that a warning from this set of indicators/models is not, in and of itself, a reason to make a change in one's position. During strong rallies - the kind that typically occur at the end of bear markets - the market will get overbought and stay overbought for quite some time. This condition is actually a sign of strength over time. Thus, the bulls will be hoping that the overbought condition can remain intact during any weakness in the near-term.
So, from a short-term perspective, things look pretty good. Next, let's take a look at the longer-term situation...
S&P 500 - Weekly 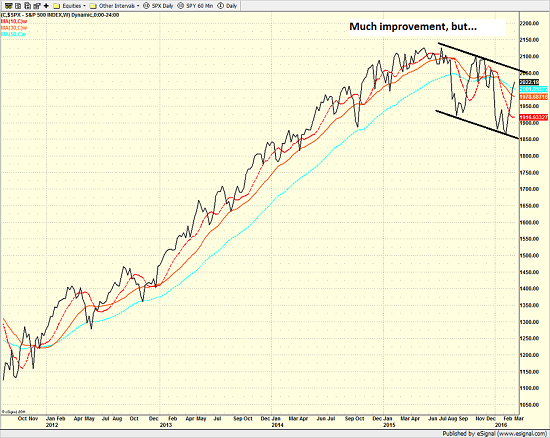
View Larger Image
Unfortunately, the song remains the same on the weekly chart of the S&P 500. Yes, there has been significant improvement in the picture. However, the downtrend channel is still in play and as such, the bulls still have some work to do if they are to break the current trend.
In order to get a feel for how probable this might be, we turn to the external factors and primary cycle boards...
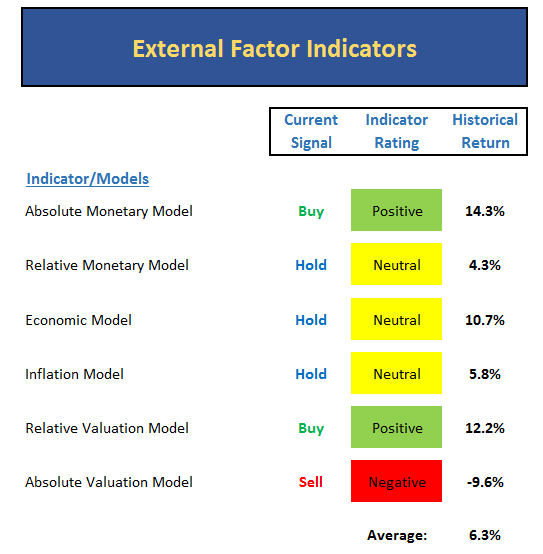
The external factor indicators review the state of the monetary, economic, inflation, and valuation indicators. Normally the message here is pretty easy to identify. However, given that we find ourselves in an era of global central bank intervention, we can't use any indicator in a vacuum. As such, we've added an extra monetary and valuation model to get a better handle on the situation.
To be sure, interest rates remain low, which has been favorable to the stock market over time. However, with the Fed now looking to return rates to more "normal" levels over time, the monetary picture has been muddied. Thus, we will call this area moderately positive.
As for the economic and inflation situation, both longer-term models are now neutral. And as the historical return numbers indicate, stocks can certainly move higher at a decent clip when these models are not positive. However, with the inflation model currently moving up and the economic model moving down, this remains a key fundamental area to watch.
Finally, the valuation picture remains a mess and requires a great degree of subjectivity in order to make heads or tails of the situation. The bottom line is the traditional valuation indicators such as price-to-earnings/dividends/book value/sales remain in overvalued territory while any indicator taking into account the current level of interest rates suggests stocks are undervalued. As such, investors are required to decide which is more important to them at this time. I'll call the situation neutral here.
And then there is our primary cycle board...
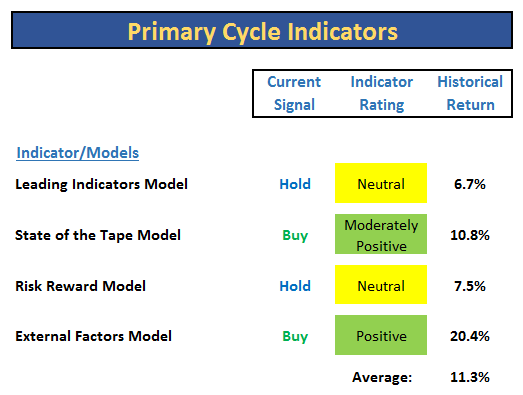
To review, these are my favorite longer-term, big picture models. And not too long ago, every model on the board except the external factor model was negative. Thus, it is nice to see that there is no longer any red visible here and that both the Leading Indicators and State of the Tape models have upticked recently. And with the average of the model's historical returns currently higher than the market's long-term average, I will have to conclude that the overall state of the market is improving - or at the very least, no longer negative.
So, in sum, stocks have embarked on a strong rally that has been accompanied by some "oomph." However, the early warning board tells us that we shouldn't be surprised by a pullback in the near-term. And the good news is that our bigger-picture models are showing signs of improvement.
However, the bottom line is the game remains all about oil at this time. So it will be important to see how the market reacts when oil pauses or retraces some of the recent spike higher.
It is my sincere hope that this type of objective rundown of the indicators is helpful. For me, this exercise helps to put things into perspective and allows me to start each week with a clear picture of what is actually happening in Ms. Market's game.
Publishing Note: I am traveling the remainder of this week. Thus, reports will be published as my schedule permits.
Turning to This Morning
Despite indications of slowing growth, soothing words from a newly appointed securities regulator helped produce green screens in Chinese markets overnight. We are also seeing decent gains in most of the bourses across the pond this morning. But remember, the game in the U.S. has been all about oil. So, with crude moving lower this morning, U.S. stock futures are following oil's lead. Finally, recall that the FOMC meeting is on tap this week and while rates are not expected to rise, traders may decide to listen to what Yellen has to say before making any further committments.
Today's Pre-Game Indicators
Here are the Pre-Market indicators we review each morning before the opening bell...
Major Foreign Markets:
Japan: +1.74%
Hong Kong: +1.17%
Shanghai: +1.75%
London: +0.28%
Germany: +1.33%
France: +0.36%
Italy: -0.17%
Spain: +0.79%
Crude Oil Futures: -$1.02 to $37.48
Gold: -$0.60 at $1258.60
Dollar: higher against the yen, euro and pound
US 10-Year Bond Yield: Currently trading at 1.962%
German 10-Year Bund Yield: Currently trading at 0.253%
Stock Indices in U.S. (relative to fair value):
S&P 500: -7.89
Dow Jones Industrial Average: -48
NASDAQ Composite: -18.37
Thought For The Day:
I've got a theory that if you give 100% all of the time, somehow things will work out in the end. -Larry Bird
Here's wishing you green screens and all the best for a great day,

David D. Moenning
Founder: Heritage Capital Research
Chief Investment Officer: Sowell Management Services
Looking for More on the State of the Markets?
!function(d,s,id){var js,fjs=d.getElementsByTagName(s)[0],p=/^http:/.test(d.location)?'http':'https';if(!d.getElementById(id)){js=d.createElement(s);js.id=id;js.src=p+'://platform.twitter.com/widgets.js';fjs.parentNode.insertBefore(js,fjs);}}(document, 'script', 'twitter-wjs');Current Market Drivers
We strive to identify the driving forces behind the market action on a daily basis. The thinking is that if we can both identify and understand why stocks are doing what they are doing on a short-term basis; we are not likely to be surprised/blind-sided by a big move. Listed below are what we believe to be the driving forces of the current market (Listed in order of importance).
1. The State of the Oil Crisis
2. The State of Global Central Bank Policy
3. The State of the Stock Market Valuations
4. The State of Global Growth
The State of the Trend
We believe it is important to analyze the market using multiple time-frames. We define short-term as 3 days to 3 weeks, intermediate-term as 3 weeks to 6 months, and long-term as 6 months or more. Below are our current ratings of the three primary trends:
Short-Term Trend (1 - 3 Weeks): Positive
(Chart below is S&P 500 daily over past 1 month)
Intermediate-Term Trend (1 - 6 Months): Neutral
(Chart below is S&P 500 daily over past 6 months)
Long-Term Trend (6 - 18 Months): Moderately Negative
(Chart below is S&P 500 daily over past 2 years)
Key Technical Areas:
Traders as well as computerized algorithms are generally keenly aware of the important technical levels on the charts from a short-term basis. Below are the levels we deem important to watch today:
- Key Near-Term Support Zone(s) for S&P 500: 1950(ish)
- Key Near-Term Resistance Zone(s): 2000-2020
The State of the Tape
Momentum indicators are designed to tell us about the technical health of a trend - I.E. if there is any "oomph" behind the move. Below are a handful of our favorite indicators relating to the market's "mo"...
- Trend and Breadth Confirmation Indicator (Short-Term): Positive
- Price Thrust Indicator: Positive
- Volume Thrust Indicator(NASDAQ): Positive
- Breadth Thrust Indicator (NASDAQ): Positive
- Short-Term Volume Relationship: Positive
- Technical Health of 100+ Industry Groups: Moderately Positive
The Early Warning Indicators
Markets travel in cycles. Thus we must constantly be on the lookout for changes in the direction of the trend. Looking at market sentiment and the overbought/sold conditions can provide "early warning signs" that a trend change may be near.
- S&P 500 Overbought/Oversold Conditions:
- Short-Term: Overbought
- Intermediate-Term: Neutral
- Market Sentiment: Our primary sentiment model is Neutral
The State of the Market Environment
One of the keys to long-term success in the stock market is stay in tune with the market's "big picture" environment in terms of risk versus reward.
- Weekly Market Environment Model Reading: Neutral
Indicator Explanations
Trend and Breadth Confirmation Indicator (Short-Term) Explained: History shows the most reliable market moves tend to occur when the breadth indices are in gear with the major market averages. When the breadth measures diverge, investors should take note that a trend reversal may be at hand. This indicator incorporates an All-Cap Dollar Weighted Equity Series and A/D Line. From 1998, when the A/D line is above its 5-day smoothing and the All-Cap Equal Weighted Equity Series is above its 25-day smoothing, the equity index has gained at a rate of +32.5% per year. When one of the indicators is above its smoothing, the equity index has gained at a rate of +13.3% per year. And when both are below, the equity index has lost +23.6% per year.
Price Thrust Indicator Explained: This indicator measures the 3-day rate of change of the Value Line Composite relative to the standard deviation of the 30-day average. When the Value Line's 3-day rate of change have moved above 0.5 standard deviation of the 30-day average ROC, a "thrust" occurs and since 2000, the Value Line Composite has gained ground at a rate of +20.6% per year. When the indicator is below 0.5 standard deviation of the 30-day, the Value Line has lost ground at a rate of -10.0% per year. And when neutral, the Value Line has gained at a rate of +5.9% per year.
Volume Thrust Indicator Explained: This indicator uses NASDAQ volume data to indicate bullish and bearish conditions for the NASDAQ Composite Index. The indicator plots the ratio of the 10-day total of NASDAQ daily advancing volume (i.e., the total volume traded in stocks which rose in price each day) to the 10-day total of daily declining volume (volume traded in stocks which fell each day). This ratio indicates when advancing stocks are attracting the majority of the volume (readings above 1.0) and when declining stocks are seeing the heaviest trading (readings below 1.0). This indicator thus supports the case that a rising market supported by heavier volume in the advancing issues tends to be the most bullish condition, while a declining market with downside volume dominating confirms bearish conditions. When in a positive mode, the NASDAQ Composite has gained at a rate of +38.3% per year, When neutral, the NASDAQ has gained at a rate of +13.3% per year. And when negative, the NASDAQ has lost at a rate of -8.5% per year.
Breadth Thrust Indicator Explained: This indicator uses the number of NASDAQ-listed stocks advancing and declining to indicate bullish or bearish breadth conditions for the NASDAQ Composite. The indicator plots the ratio of the 10-day total of the number of stocks rising on the NASDAQ each day to the 10-day total of the number of stocks declining each day. Using 10-day totals smooths the random daily fluctuations and gives indications on an intermediate-term basis. As expected, the NASDAQ Composite performs much better when the 10-day A/D ratio is high (strong breadth) and worse when the indicator is in its lower mode (weak breadth). The most bullish conditions for the NASDAQ when the 10-day A/D indicator is not only high, but has recently posted an extreme high reading and thus indicated a thrust of upside momentum. Bearish conditions are confirmed when the indicator is low and has recently signaled a downside breadth thrust. In positive mode, the NASDAQ has gained at a rate of +22.1% per year since 1981. In a neutral mode, the NASDAQ has gained at a rate of +14.5% per year. And when in a negative mode, the NASDAQ has lost at a rate of -6.4% per year.
Bull/Bear Volume Relationship Explained: This indicator plots both "supply" and "demand" volume lines. When the Demand Volume line is above the Supply Volume line, the indicator is bullish. From 1981, the stock market has gained at an average annual rate of +11.7% per year when in a bullish mode. When the Demand Volume line is below the Supply Volume line, the indicator is bearish. When the indicator has been bearish, the market has lost ground at a rate of -6.1% per year.
Technical Health of 100 Industry Groups Explained: Designed to provide a reading on the technical health of the overall market, this indicator takes the technical temperature of more than 100 industry sectors each week. Looking back to early 1980, when the model is rated as "positive," the S&P has averaged returns in excess of 23% per year. When the model carries a "neutral" reading, the S&P has returned over 11% per year. But when the model is rated "negative," stocks fall by more than -13% a year on average.
Weekly State of the Market Model Reading Explained:Different market environments require different investing strategies. To help us identify the current environment, we look to our longer-term State of the Market Model. This model is designed to tell us when risk factors are high, low, or uncertain. In short, this longer-term oriented, weekly model tells us whether the odds favor the bulls, bears, or neither team.
Disclosures
The opinions and forecasts expressed herein are those of Mr. David Moenning and may not actually come to pass. Mr. Moenning's opinions and viewpoints regarding the future of the markets should not be construed as recommendations. The analysis and information in this report is for informational purposes only. No part of the material presented in this report is intended as an investment recommendation or investment advice. Neither the information nor any opinion expressed constitutes a solicitation to purchase or sell securities or any investment program.
Any investment decisions must in all cases be made by the reader or by his or her investment adviser. Do NOT ever purchase any security without doing sufficient research. There is no guarantee that the investment objectives outlined will actually come to pass. All opinions expressed herein are subject to change without notice. Neither the editor, employees, nor any of their affiliates shall have any liability for any loss sustained by anyone who has relied on the information provided.
The analysis provided is based on both technical and fundamental research and is provided "as is" without warranty of any kind, either expressed or implied. Although the information contained is derived from sources which are believed to be reliable, they cannot be guaranteed.
David D. Moenning is an investment adviser representative of Sowell Management Services, a registered investment advisor. For a complete description of investment risks, fees and services, review the firm brochure (ADV Part 2) which is available by contacting Sowell. Sowell is not registered as a broker-dealer.
Employees and affiliates of Sowell may at times have positions in the securities referred to and may make purchases or sales of these securities while publications are in circulation. Positions may change at any time.
Investments in equities carry an inherent element of risk including the potential for significant loss of principal. Past performance is not an indication of future results.
Advisory services are offered through Sowell Management Services.
Recent free content from FrontRange Trading Co.
-
 Is The Bull Argument Too Easy These Days?
— 8/31/20
Is The Bull Argument Too Easy These Days?
— 8/31/20
-
What Do The Cycles Say About 2020?
— 1/21/20
-
Modeling 2020 Expectations (Just For Fun)
— 1/13/20
-
Tips From Real-World Wendy Rhoades
— 5/06/19
-
The Best Recession Ever!
— 4/29/19
-
{[comment.author.username]} {[comment.author.username]} — Marketfy Staff — Maven — Member


- 1 Campus Martius, Suite #200Detroit, MI 48226
- +1 877 440 9464